Fig. 7.
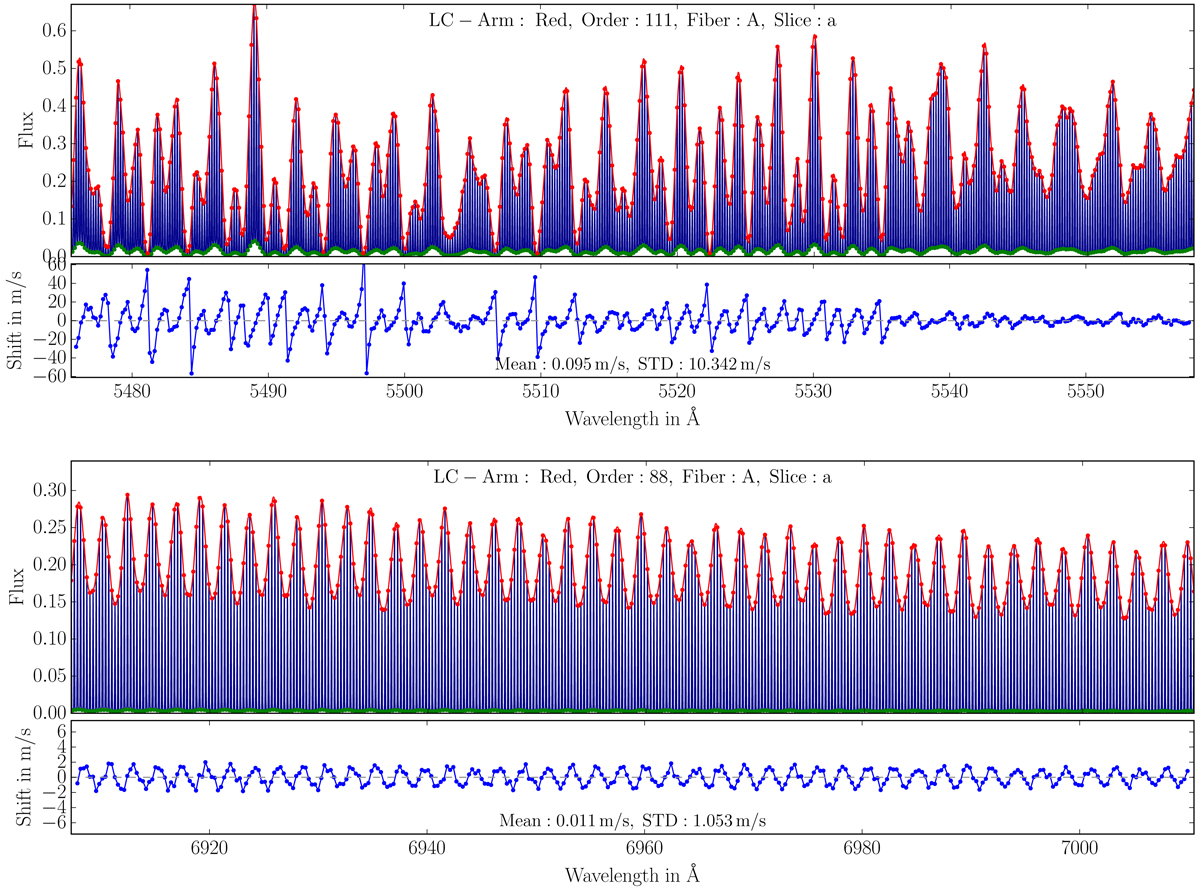
Laser frequency comb spectra of two selected spectral orders (top panels) together with the differences of the line positions obtained in fits with and without subtracting the background light model (bottom panels). Identical to Fig. 6, models for the LFC flux envelope and background light are shown in red and green. The line shifts clearly correlate in amplitude and phase with the spectral shape of the background light. These two examples also highlight that the modulation patterns of flux envelope and LFC background light can be vastly different across the spectral range.
Current usage metrics show cumulative count of Article Views (full-text article views including HTML views, PDF and ePub downloads, according to the available data) and Abstracts Views on Vision4Press platform.
Data correspond to usage on the plateform after 2015. The current usage metrics is available 48-96 hours after online publication and is updated daily on week days.
Initial download of the metrics may take a while.