Fig. 6.
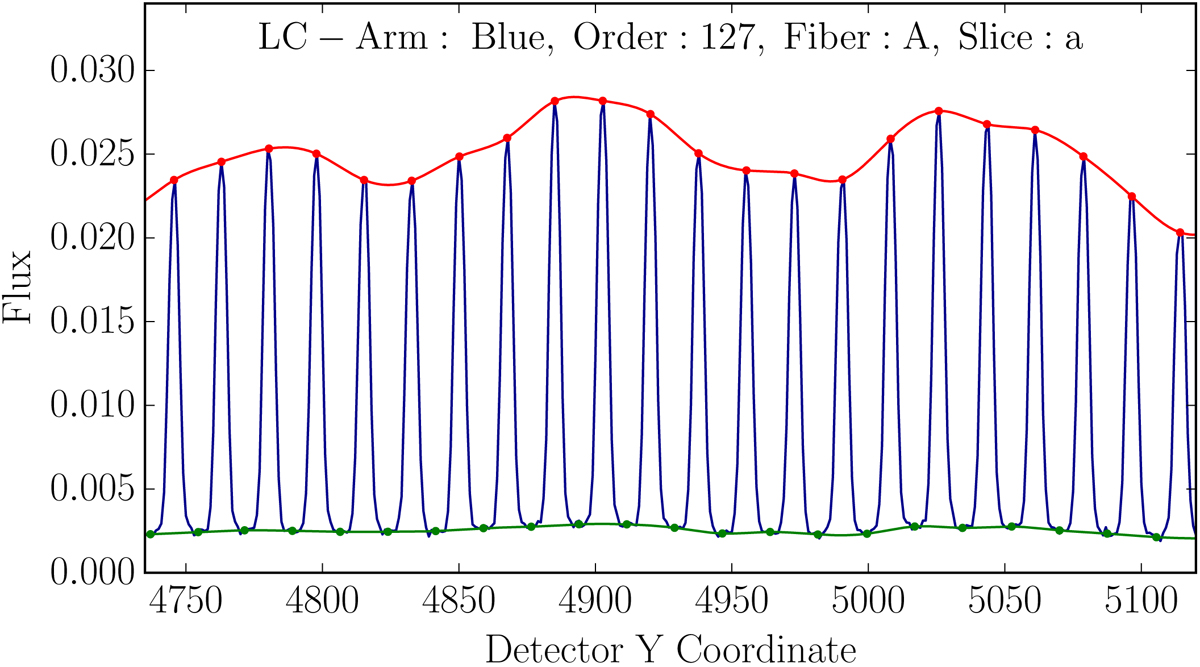
Small part of a laser frequency comb spectrum, showing the dense forest of equally-spaced narrow emission lines. The flux is given relative to the flatfield. The LFC spectrum exhibits a significant background light contribution (green) and modulation of the line intensities (red), which are both modeled as part of the analysis with cubic splines.
Current usage metrics show cumulative count of Article Views (full-text article views including HTML views, PDF and ePub downloads, according to the available data) and Abstracts Views on Vision4Press platform.
Data correspond to usage on the plateform after 2015. The current usage metrics is available 48-96 hours after online publication and is updated daily on week days.
Initial download of the metrics may take a while.