Fig. 5.
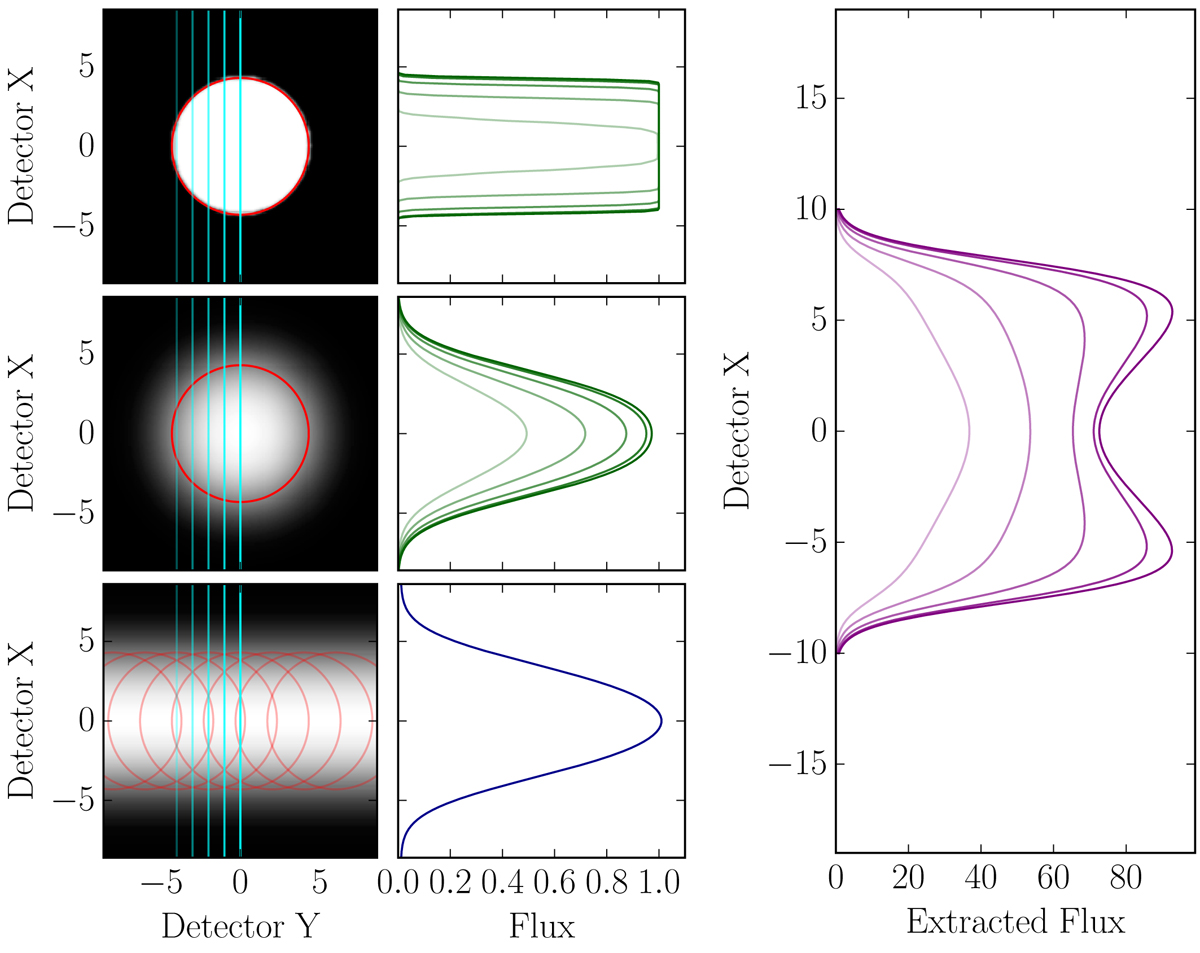
Simple model illustrating the mismatch of trace profiles between FP and flatfield spectra. The left column shows the flux distribution on the detector for a monochromatic source fed to an idealized fiber-spectrograph (top), the same monochromatic source affected by some instrumental blurring (center), and a spectrally-flat broadband source (bottom). The central column shows cuts through these flux distributions in cross-dispersion direction at different locations. The positions of the cuts are indicated in the left panels by vertical cyan lines. Decreasing color saturation corresponds to increasing offset from the center. The right panel displays the cross-sections from the central row divided by the profiles shown in the bottom row of panels. This corresponds to the normalization of FP spectra by trace profiles extracted from a flatfield spectrum. Clearly, there is a discrepancy between the trace profiles and the normalized flux does not exhibit the desired flat distribution along cross-dispersion direction.
Current usage metrics show cumulative count of Article Views (full-text article views including HTML views, PDF and ePub downloads, according to the available data) and Abstracts Views on Vision4Press platform.
Data correspond to usage on the plateform after 2015. The current usage metrics is available 48-96 hours after online publication and is updated daily on week days.
Initial download of the metrics may take a while.