Fig. 4.
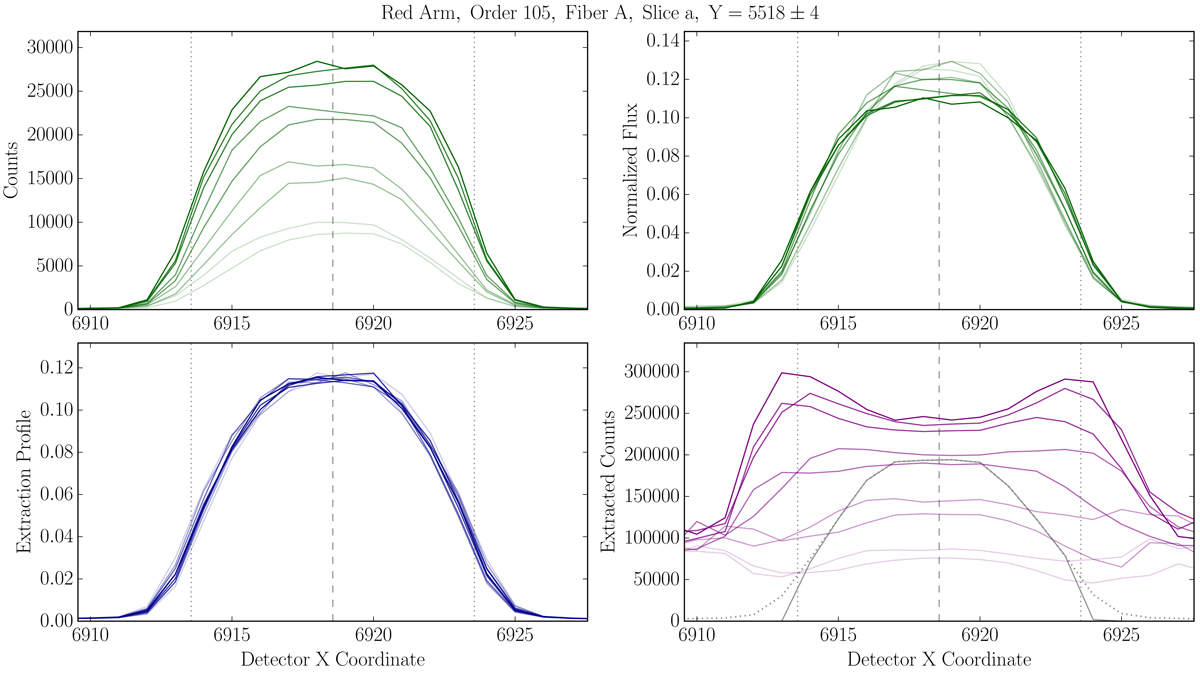
Illustration of various cuts through the trace in detector X direction (cross-dispersion). Top left panel: nine trace profiles shown in terms of raw counts, i.e., Cyx. The central cut lies exactly at the peak of a FP line. The others are offset in detector Y (wavelength) direction by up to ±4 pixels. The saturation of the line color indicates the offset from the line. Top right panel: same as top-left panel but all profiles are normalized to unity flux, highlighting the different shapes. Bottom left panel: trace profiles extracted from a spectral flatfield frame at the same positions as the curves in the top panels, i.e Pyx. No significant dependence on the position is observed. Bottom right panel: raw counts from the FP frame normalized by the corresponding trace profiles, i.e., the quantity Cyx/Pyx. The gray dotted curve shows the inverse-variance weighting ![]() (arbitrary scale). The solid gray curve represents the full weighting function including the window function
(arbitrary scale). The solid gray curve represents the full weighting function including the window function ![]() , which limits the extraction to ±5 pixels (vertical dotted lines).
, which limits the extraction to ±5 pixels (vertical dotted lines).
Current usage metrics show cumulative count of Article Views (full-text article views including HTML views, PDF and ePub downloads, according to the available data) and Abstracts Views on Vision4Press platform.
Data correspond to usage on the plateform after 2015. The current usage metrics is available 48-96 hours after online publication and is updated daily on week days.
Initial download of the metrics may take a while.