Fig. 3.
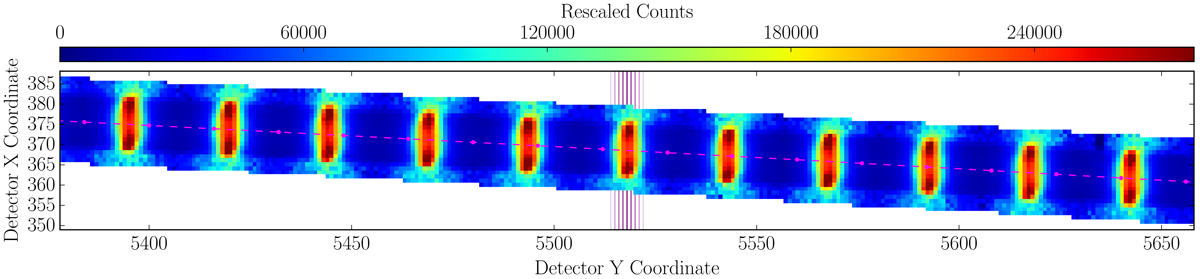
Extraction of a small part of a Fabry-Pérot calibration frame. The plot shows the bias and scattered-light subtracted raw counts normalized by the trace profile. The region on the detector is identical to the one shown in Fig. 2. Clearly visible is the sequence of equally-spaced narrow emission lines. However, in contrast to the expectation, significant structure in cross-dispersion direction is present. The vertical purple lines correspond to the positions of the cuts shown in Fig. 4.
Current usage metrics show cumulative count of Article Views (full-text article views including HTML views, PDF and ePub downloads, according to the available data) and Abstracts Views on Vision4Press platform.
Data correspond to usage on the plateform after 2015. The current usage metrics is available 48-96 hours after online publication and is updated daily on week days.
Initial download of the metrics may take a while.