Fig. 12.
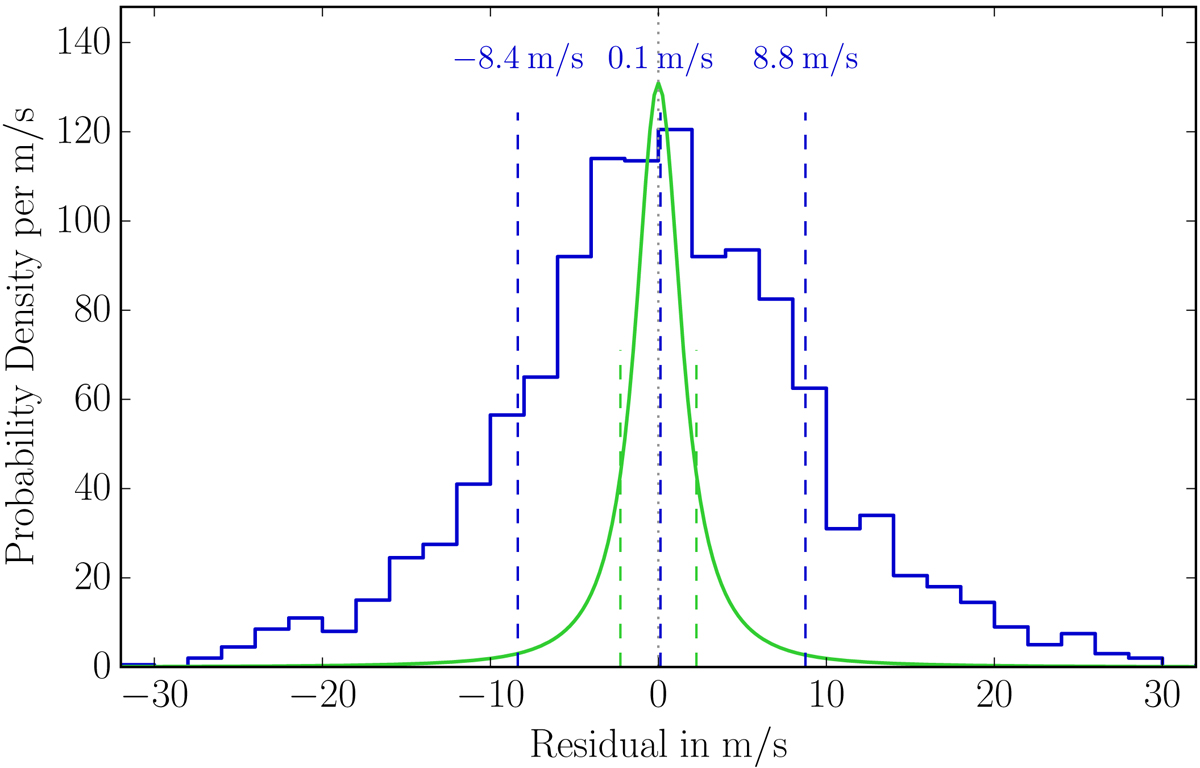
Histogram of the Deff(λ) residuals shown in the bottom panel of Fig. 11. The 16th, 50th, and 84th percentiles are labeled in the plot. The expected distribution based on the formal uncertainties of the datapoints (laboratory wavelength and fitting error) is shown in green, for visualization purpose with a Y-scale reduced to ![]() . The dispersion of the expected distribution is 2.3 m s−1.
. The dispersion of the expected distribution is 2.3 m s−1.
Current usage metrics show cumulative count of Article Views (full-text article views including HTML views, PDF and ePub downloads, according to the available data) and Abstracts Views on Vision4Press platform.
Data correspond to usage on the plateform after 2015. The current usage metrics is available 48-96 hours after online publication and is updated daily on week days.
Initial download of the metrics may take a while.