Fig. 11.
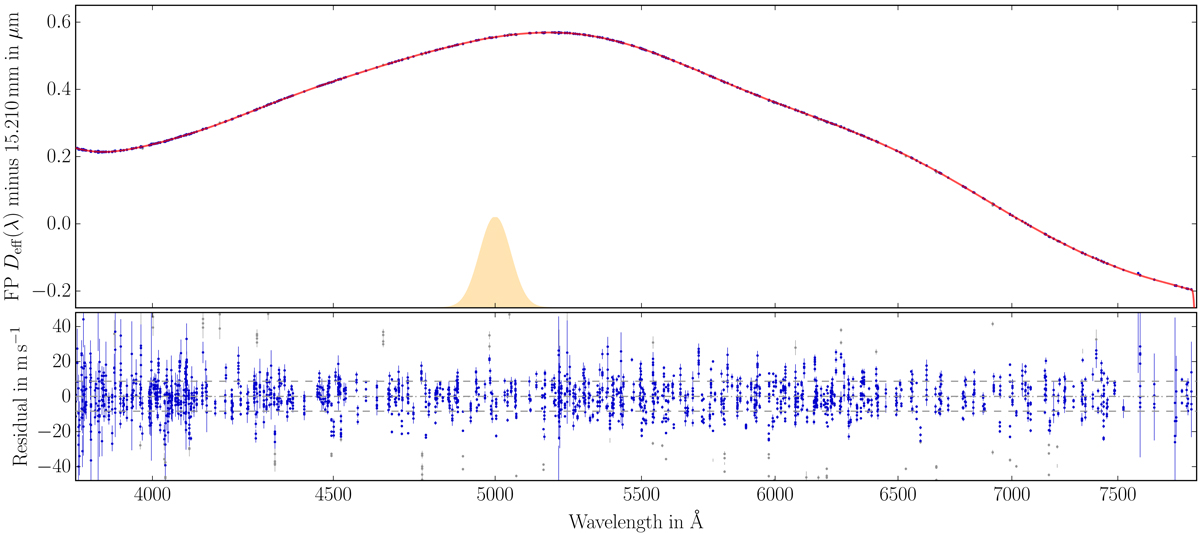
Visualization of the Deff(λ) determination. The top panel shows the individual measurements of the FP effective gap size obtained from the ThAr lines (blue) and the interpolated smooth function (red). For better visualization, a value of 15.210 mm, approximately the mean Deff, is subtracted from measurements and Deff(λ) function. The bottom panel shows the corresponding residuals. Uncertainties of the ![]() measurements are based on the combined laboratory wavelength and line fitting error. Points rejected by the sigma-clipping procedure are shown in gray. A representation of the smoothing kernel used by the interpolation scheme is displayed in orange.
measurements are based on the combined laboratory wavelength and line fitting error. Points rejected by the sigma-clipping procedure are shown in gray. A representation of the smoothing kernel used by the interpolation scheme is displayed in orange.
Current usage metrics show cumulative count of Article Views (full-text article views including HTML views, PDF and ePub downloads, according to the available data) and Abstracts Views on Vision4Press platform.
Data correspond to usage on the plateform after 2015. The current usage metrics is available 48-96 hours after online publication and is updated daily on week days.
Initial download of the metrics may take a while.