Free Access
Fig. 10.
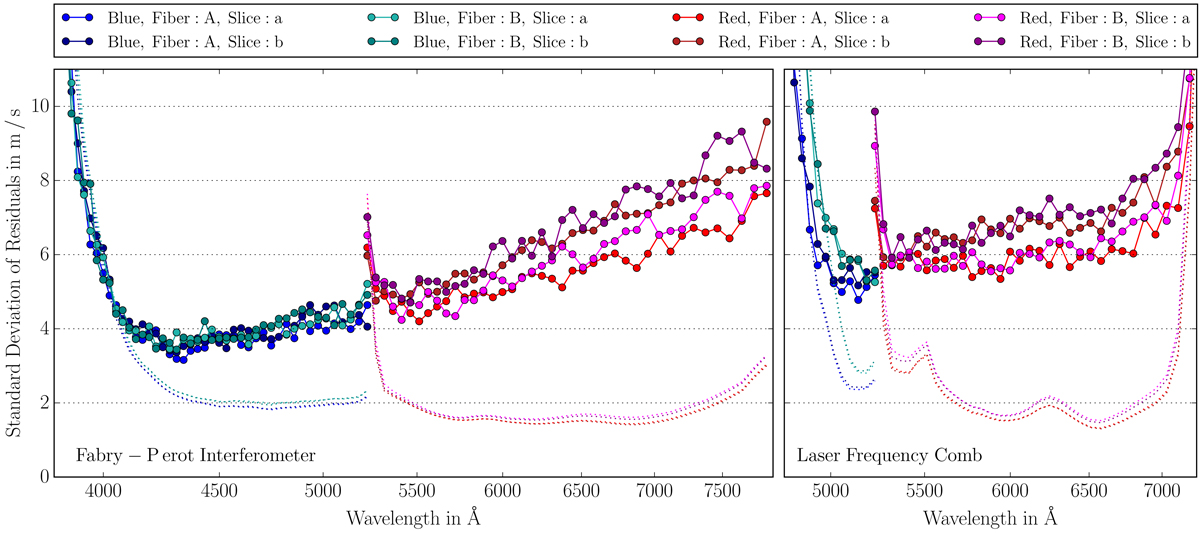
Summary of the difference between smoothed and non-smoothed FP and LFC line positions. Points show for each spectral order the standard deviation, derived from the 16th–84th percentile interval (compare to Fig. 9). Dotted lines indicate the mean error of the individual line positions.
Current usage metrics show cumulative count of Article Views (full-text article views including HTML views, PDF and ePub downloads, according to the available data) and Abstracts Views on Vision4Press platform.
Data correspond to usage on the plateform after 2015. The current usage metrics is available 48-96 hours after online publication and is updated daily on week days.
Initial download of the metrics may take a while.