Fig. 4.
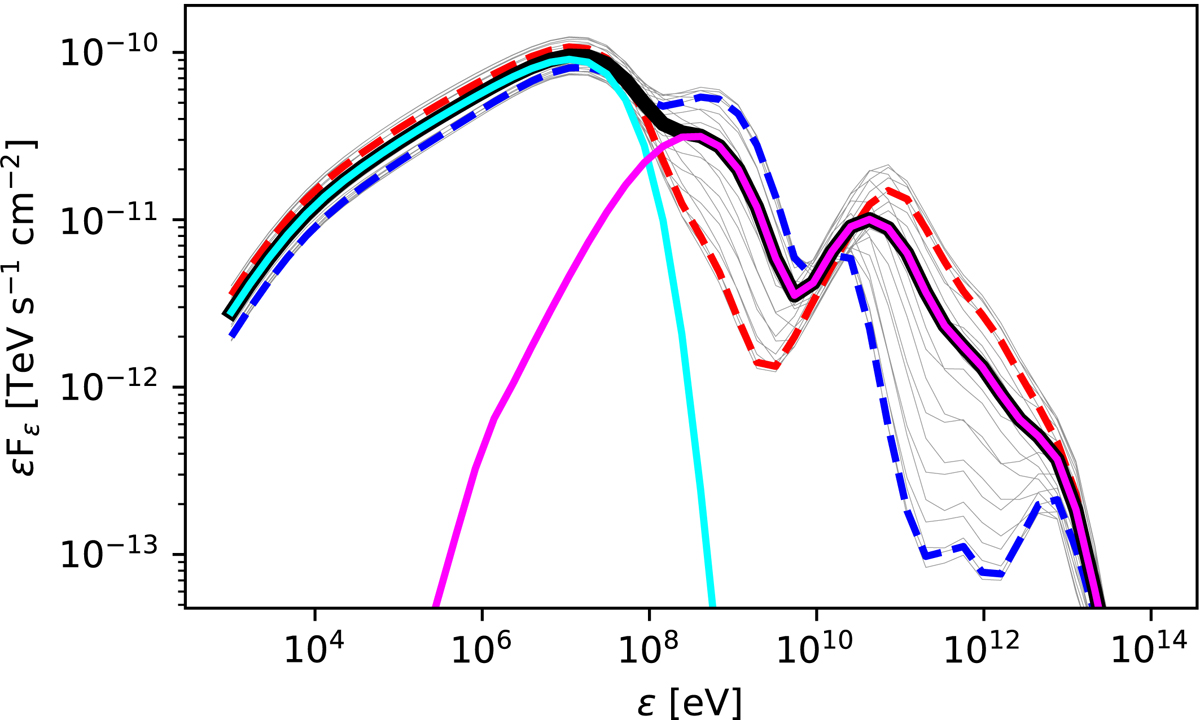
Spectral energy distribution of the emission predicted by our model for a generic binary with a system inclination of 30°. The results are shown for the sampled orbital phases (grey) and their average (black). The average spectral distribution is further split into the individual radiative processes: synchrotron (green) and inverse Compton attenuated by γγ -absorption (orange). Inferior (dashed red, ϕ = 0) and superior conjunction (dashed blue, ϕ = 0.5) emissions are highlighted.
Current usage metrics show cumulative count of Article Views (full-text article views including HTML views, PDF and ePub downloads, according to the available data) and Abstracts Views on Vision4Press platform.
Data correspond to usage on the plateform after 2015. The current usage metrics is available 48-96 hours after online publication and is updated daily on week days.
Initial download of the metrics may take a while.