Fig. 2.
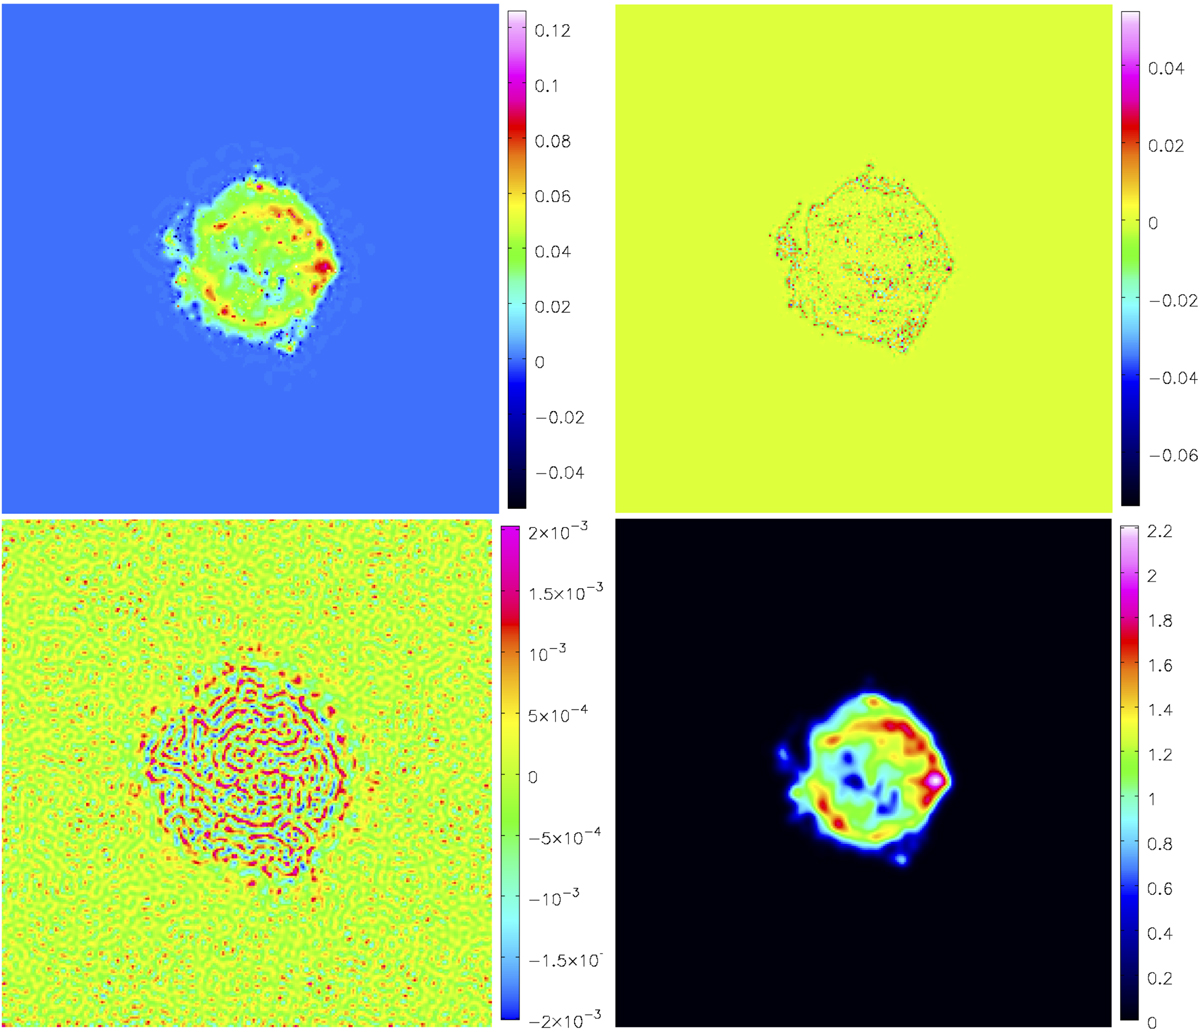
Reconstruction results of source Cassiopeia A from the RMS-Clean algorithm. Top left: reconstructed model image. Top right: model error image, which is the difference between the reference model image and the reconstructed model image. Bottom left: residual image. Bottom right: restored image, which is the sum of the reconstructed model image convolved with the CLEAN beam and the final residuals. The specified scale list is [0, 7, 15, 22, 30] pixels that are randomly perturbed during the RMS-Clean deconvolution. The specified scale list can also be written as the relation between a scale list and the PSF main lobe, which has more physical meaning. For example, [0, 7, 15, 22, 30] pixels = [0, 3.3, 10.5, 14.3] × 2.1 pixels for this experiment. However, these two representations are completely equivalent because the PSF main lobe is a constant for a given experiment and only a common factor is extracted for the second representation.
Current usage metrics show cumulative count of Article Views (full-text article views including HTML views, PDF and ePub downloads, according to the available data) and Abstracts Views on Vision4Press platform.
Data correspond to usage on the plateform after 2015. The current usage metrics is available 48-96 hours after online publication and is updated daily on week days.
Initial download of the metrics may take a while.