Fig. 5
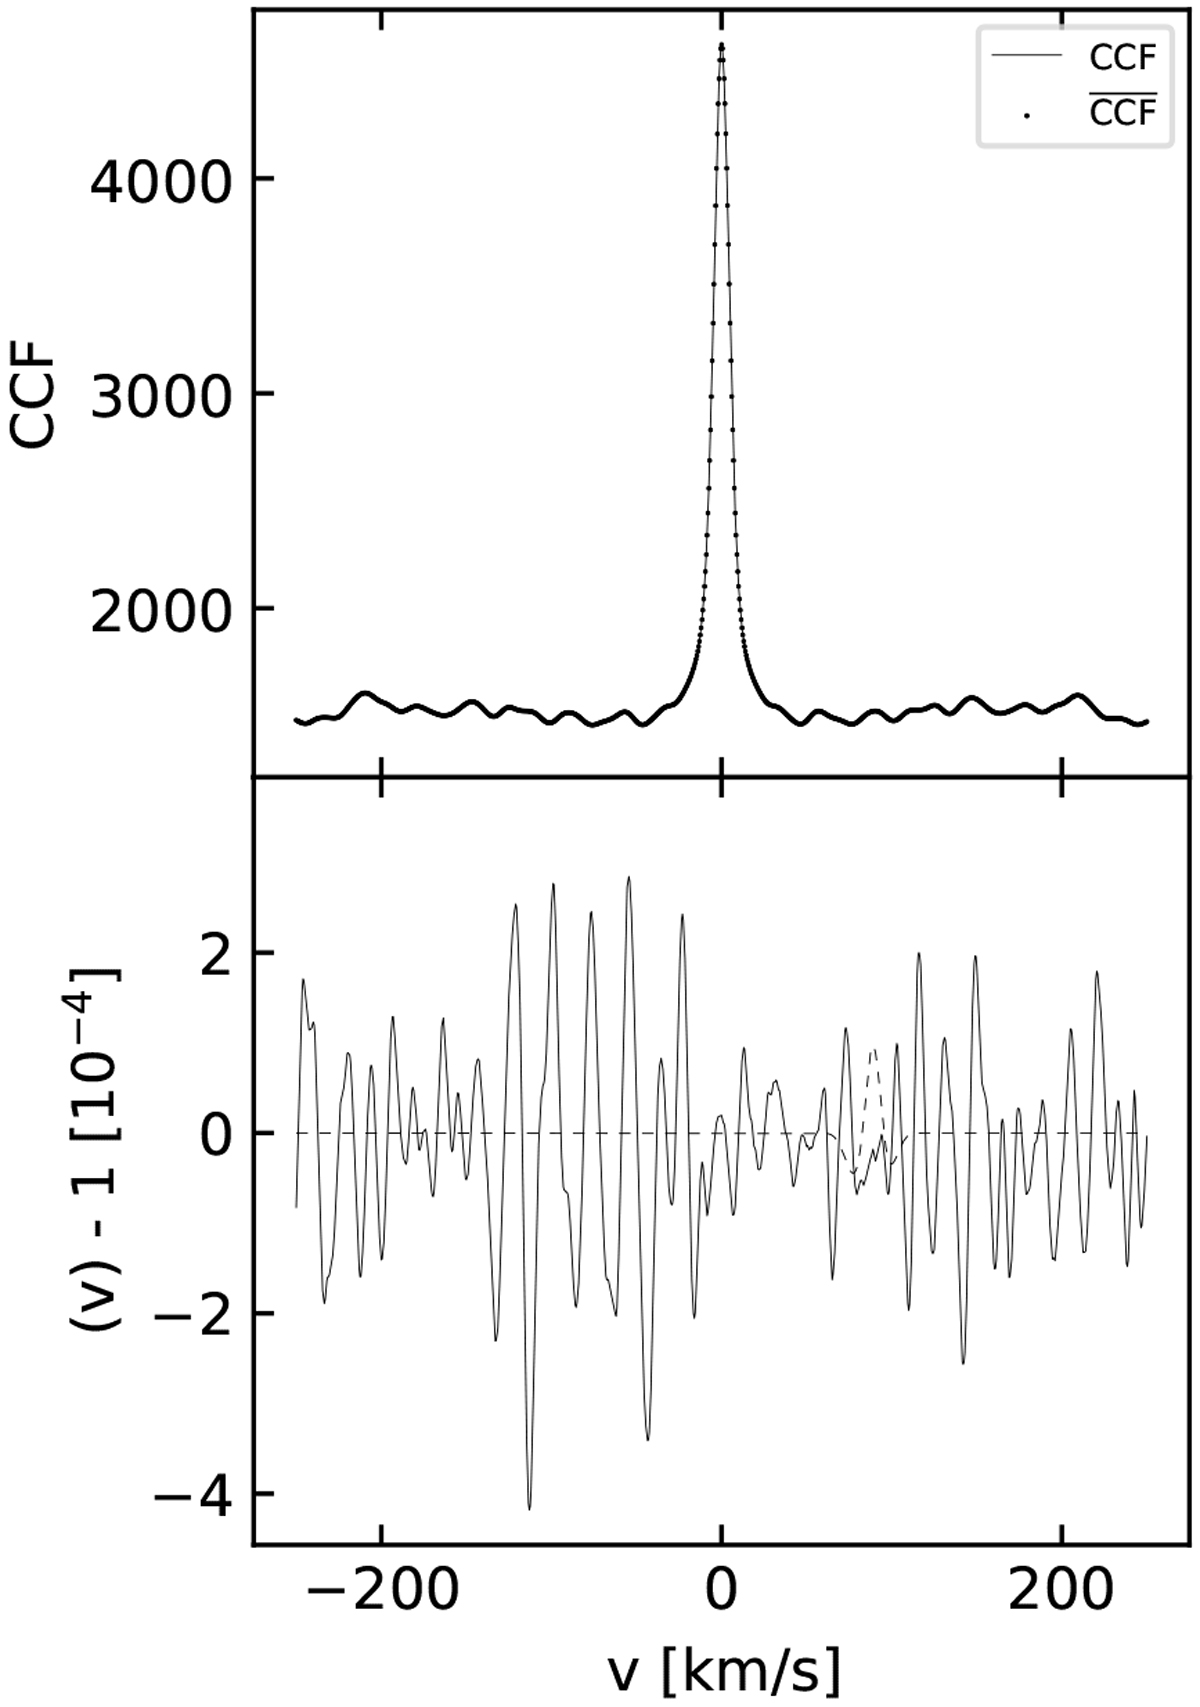
Example of the test discussed in the text. Top panel: comparison between the individual CCF and the average CCF of the simulated stellar spectra. Bottom panel: normalization of the CCF shown in the top panel. The dashed smooth line shows the expected noiseless signal as in Eq. (19), thus marking the position of the injected planetary CCF.
Current usage metrics show cumulative count of Article Views (full-text article views including HTML views, PDF and ePub downloads, according to the available data) and Abstracts Views on Vision4Press platform.
Data correspond to usage on the plateform after 2015. The current usage metrics is available 48-96 hours after online publication and is updated daily on week days.
Initial download of the metrics may take a while.