Free Access
Fig. E.1.
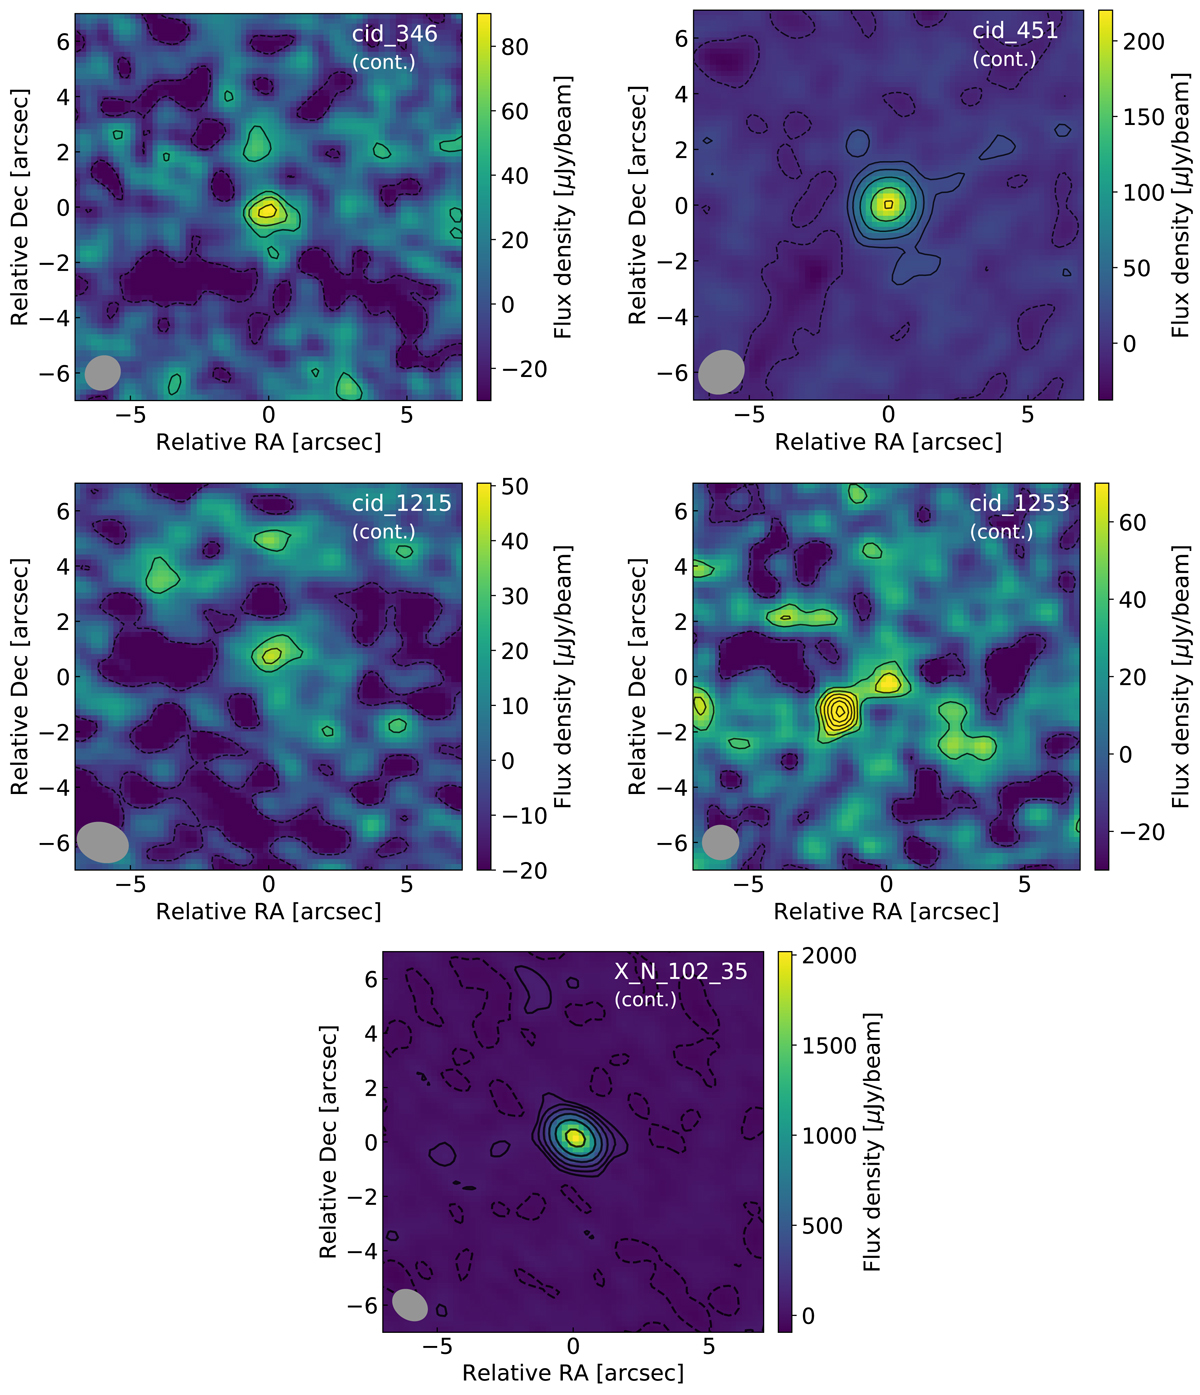
Continuum emission maps at ∼100 GHz. Black contours are in steps of 1σ, starting from 2σ, for all targets but cid_451 (σ × [2, 4, 8, 16, 24]) and X_N_102_35 (σ × [2, 4, 8, 16, 32, 64]). Dashed contours correspond to −1σ. The beam of each observation is shown as a gray ellipse on the bottom-left of the maps.
Current usage metrics show cumulative count of Article Views (full-text article views including HTML views, PDF and ePub downloads, according to the available data) and Abstracts Views on Vision4Press platform.
Data correspond to usage on the plateform after 2015. The current usage metrics is available 48-96 hours after online publication and is updated daily on week days.
Initial download of the metrics may take a while.