Fig. C.1.
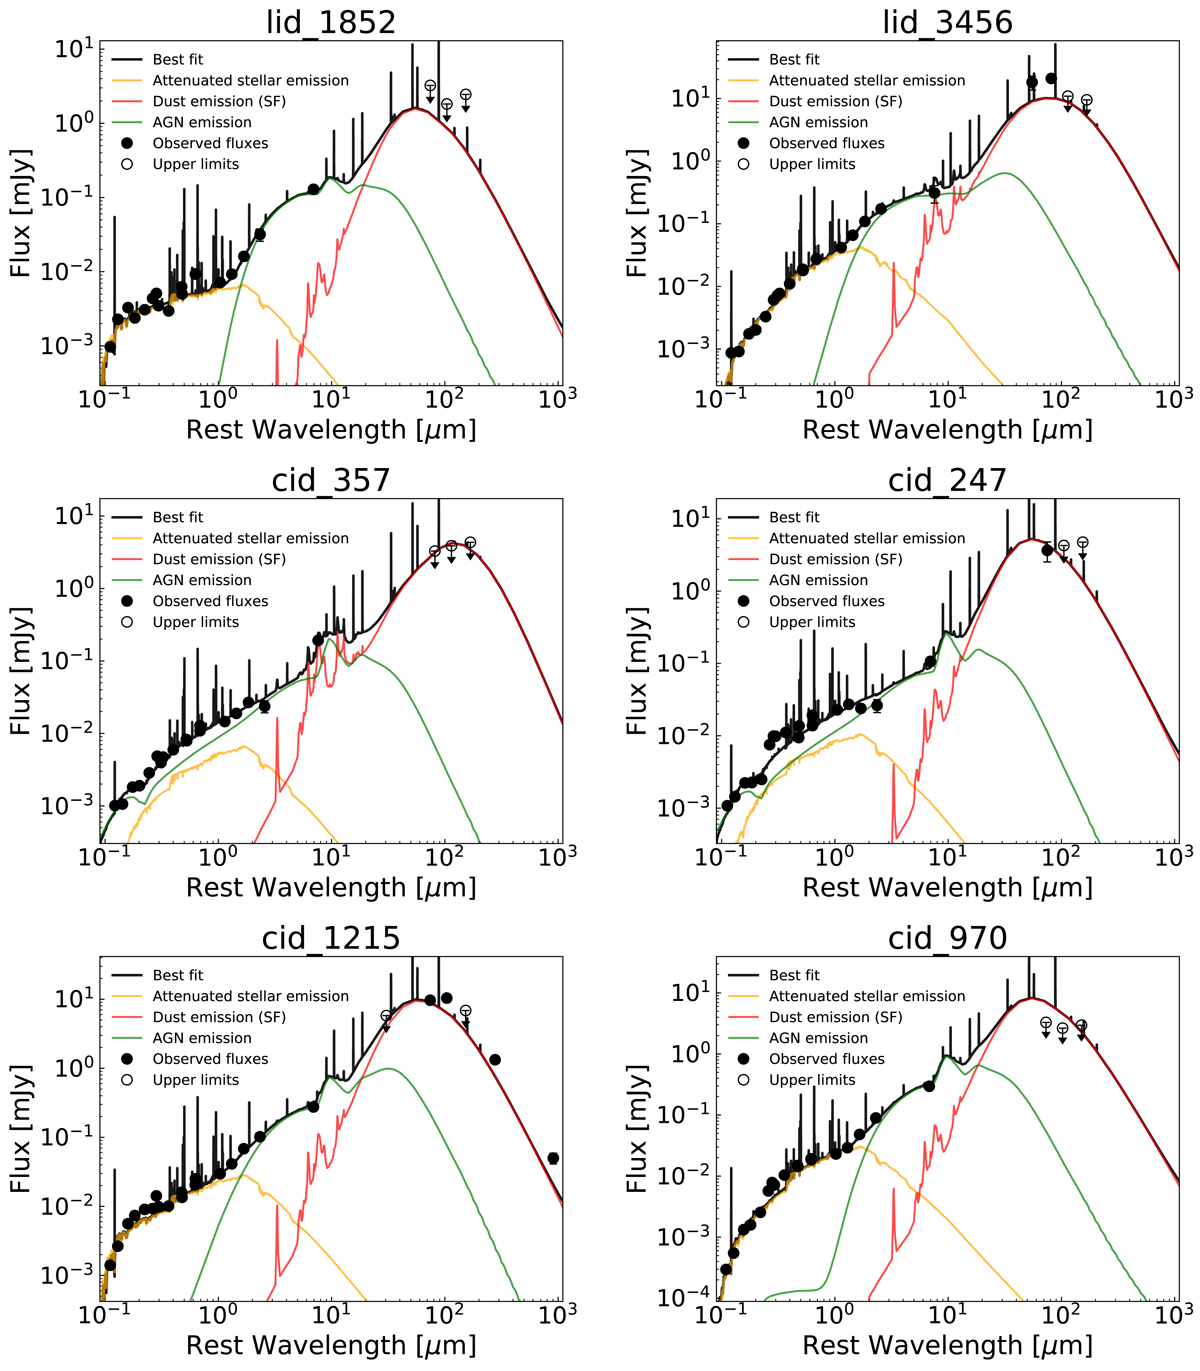
Rest-frame SEDs of the targets that were not presented in Circosta et al. (2018). The black dots represent the observed multiwavelength photometry, while the empty dots indicate 3σ upper limits. The black solid line is the total best-fit model, the orange curve represents the stellar emission attenuated by dust, the green template reproduces the AGN emission, the red curve accounts for dust emission heated by star formation. Emission lines in the black curves are part of the nebular emission component, included in the overall SED.
Current usage metrics show cumulative count of Article Views (full-text article views including HTML views, PDF and ePub downloads, according to the available data) and Abstracts Views on Vision4Press platform.
Data correspond to usage on the plateform after 2015. The current usage metrics is available 48-96 hours after online publication and is updated daily on week days.
Initial download of the metrics may take a while.