Fig. 4.
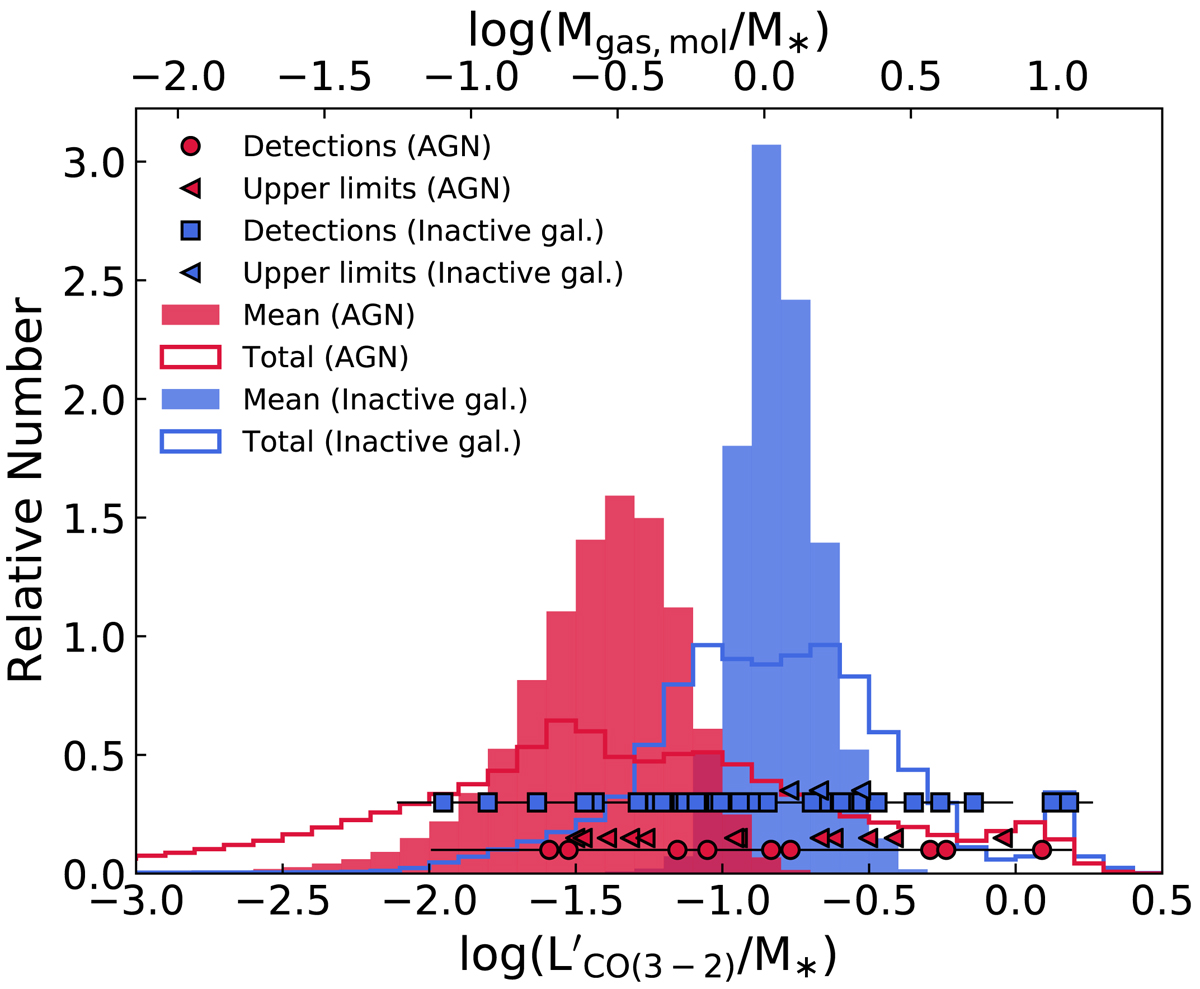
Distribution of the ratio between ![]() and stellar mass (proxy of gas fraction) for AGN (red) and inactive galaxies (blue). The filled histograms show the sampled posterior distribution of the mean (μ) of the hierarchical Gaussian prior adopted in our Bayesian analysis. In the bottom part of the plot, individual detections and upper limits are displayed. The unfilled histograms represent the total distributions and were obtained by joining the sampled posterior distributions of each target in the AGN or inactive galaxy sample. AGN show a mean log(
and stellar mass (proxy of gas fraction) for AGN (red) and inactive galaxies (blue). The filled histograms show the sampled posterior distribution of the mean (μ) of the hierarchical Gaussian prior adopted in our Bayesian analysis. In the bottom part of the plot, individual detections and upper limits are displayed. The unfilled histograms represent the total distributions and were obtained by joining the sampled posterior distributions of each target in the AGN or inactive galaxy sample. AGN show a mean log(![]() /M*) of
/M*) of ![]() , while for inactive galaxies we find
, while for inactive galaxies we find ![]() . The log(
. The log(![]() /M*) ratio of AGN is lower than inactive galaxies by a factor ∼3.7 (0.57 dex), at the 2.2σ level. The two distributions are significantly different, as confirmed by statistical tests (see text).
/M*) ratio of AGN is lower than inactive galaxies by a factor ∼3.7 (0.57 dex), at the 2.2σ level. The two distributions are significantly different, as confirmed by statistical tests (see text).
Current usage metrics show cumulative count of Article Views (full-text article views including HTML views, PDF and ePub downloads, according to the available data) and Abstracts Views on Vision4Press platform.
Data correspond to usage on the plateform after 2015. The current usage metrics is available 48-96 hours after online publication and is updated daily on week days.
Initial download of the metrics may take a while.