Fig. 3.
![]() and molecular gas masses as a function of M* for our AGN sample (red circles) and inactive galaxies (blue squares; Tacconi et al. 2018). Top: bisector fit performed by adopting a Bayesian framework to display the distribution of the two samples (see text). The dispersion of the fits is given by plotting 500 realizations of the bisector fit. We do not identify a clear difference between the two samples, since the fits are consistent within the uncertainties. Bottom: mean
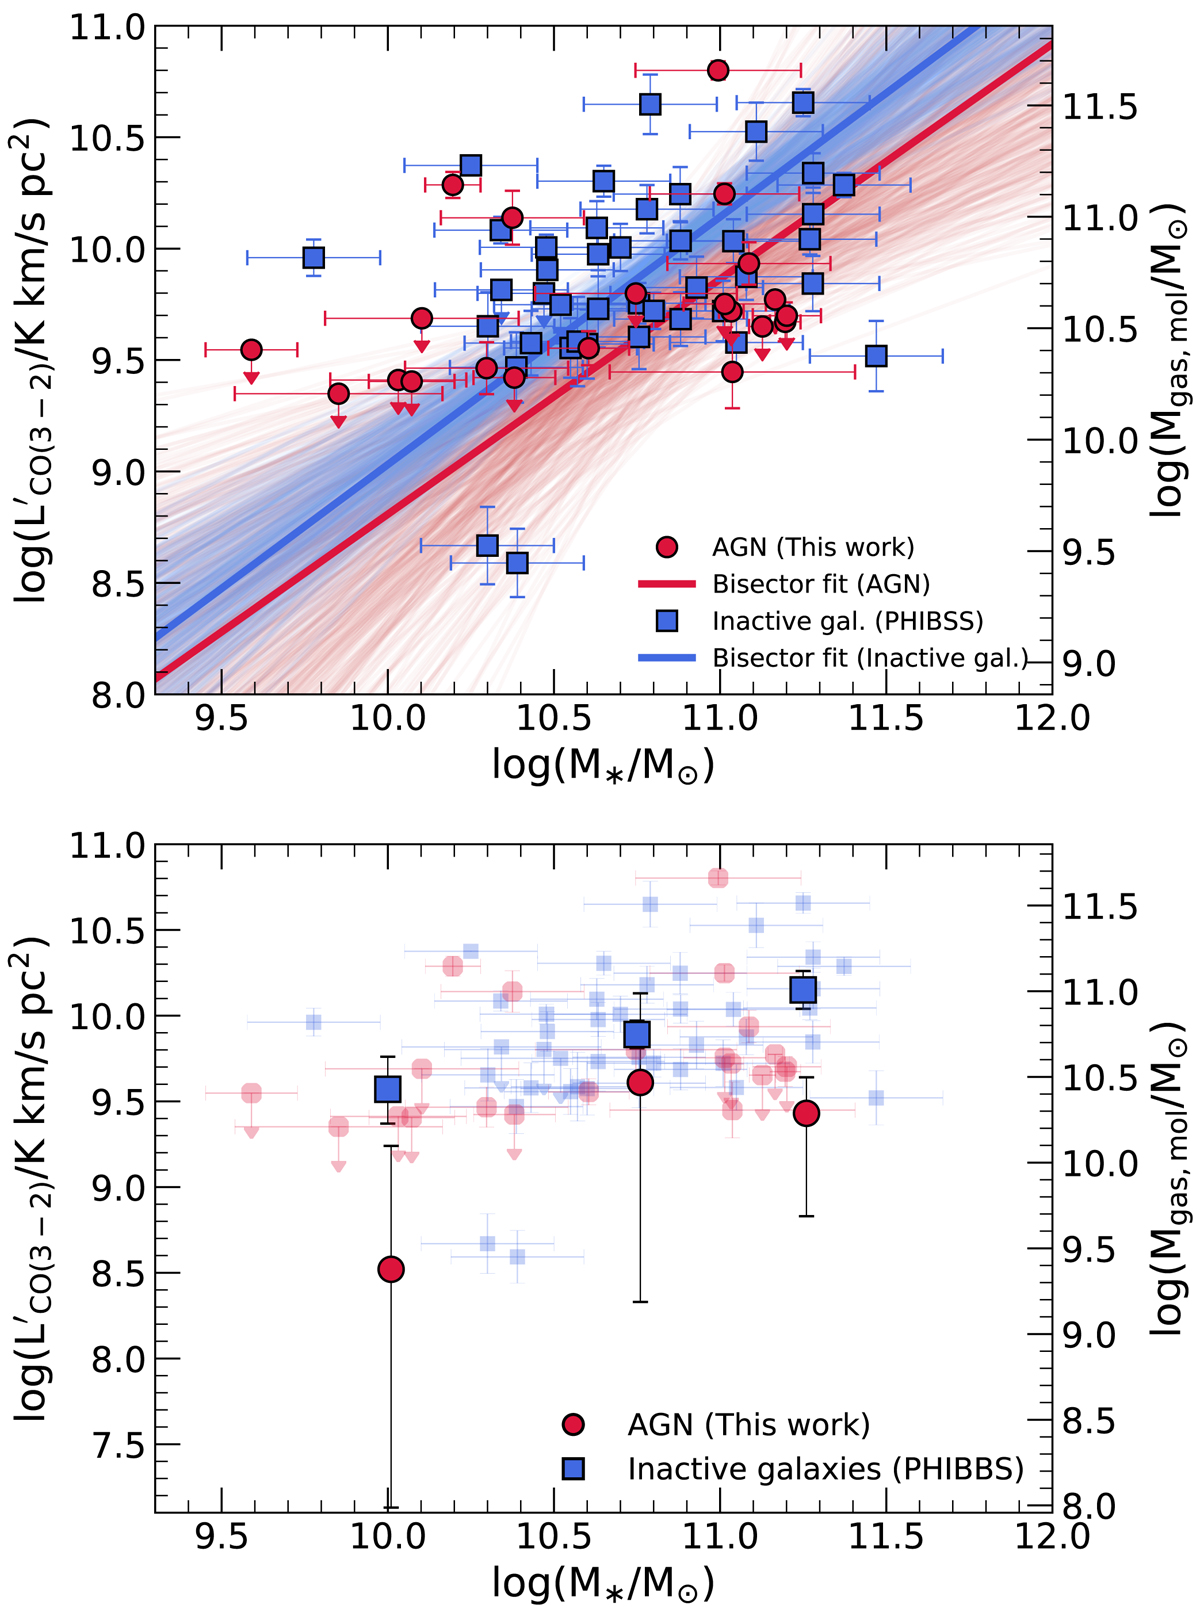
and molecular gas masses as a function of M* for our AGN sample (red circles) and inactive galaxies (blue squares; Tacconi et al. 2018). Top: bisector fit performed by adopting a Bayesian framework to display the distribution of the two samples (see text). The dispersion of the fits is given by plotting 500 realizations of the bisector fit. We do not identify a clear difference between the two samples, since the fits are consistent within the uncertainties. Bottom: mean ![]() per bin of stellar mass obtained by using a hierarchical Bayesian approach plotted in darker colors (see text). In the background, with lighter colors, we plot the distribution of the observed quantities, as in the top panel. Due to the large number of upper limits in our sample and the small statistics, error bars are quite large therefore it is difficult to assess in a robust way the true distribution of AGN. The difference is better constrained in the high-mass bin, where AGN show a mean CO luminosity lower than inactive galaxies by 0.72 dex at the ∼3σ level.
per bin of stellar mass obtained by using a hierarchical Bayesian approach plotted in darker colors (see text). In the background, with lighter colors, we plot the distribution of the observed quantities, as in the top panel. Due to the large number of upper limits in our sample and the small statistics, error bars are quite large therefore it is difficult to assess in a robust way the true distribution of AGN. The difference is better constrained in the high-mass bin, where AGN show a mean CO luminosity lower than inactive galaxies by 0.72 dex at the ∼3σ level.
Current usage metrics show cumulative count of Article Views (full-text article views including HTML views, PDF and ePub downloads, according to the available data) and Abstracts Views on Vision4Press platform.
Data correspond to usage on the plateform after 2015. The current usage metrics is available 48-96 hours after online publication and is updated daily on week days.
Initial download of the metrics may take a while.