Fig. 2.
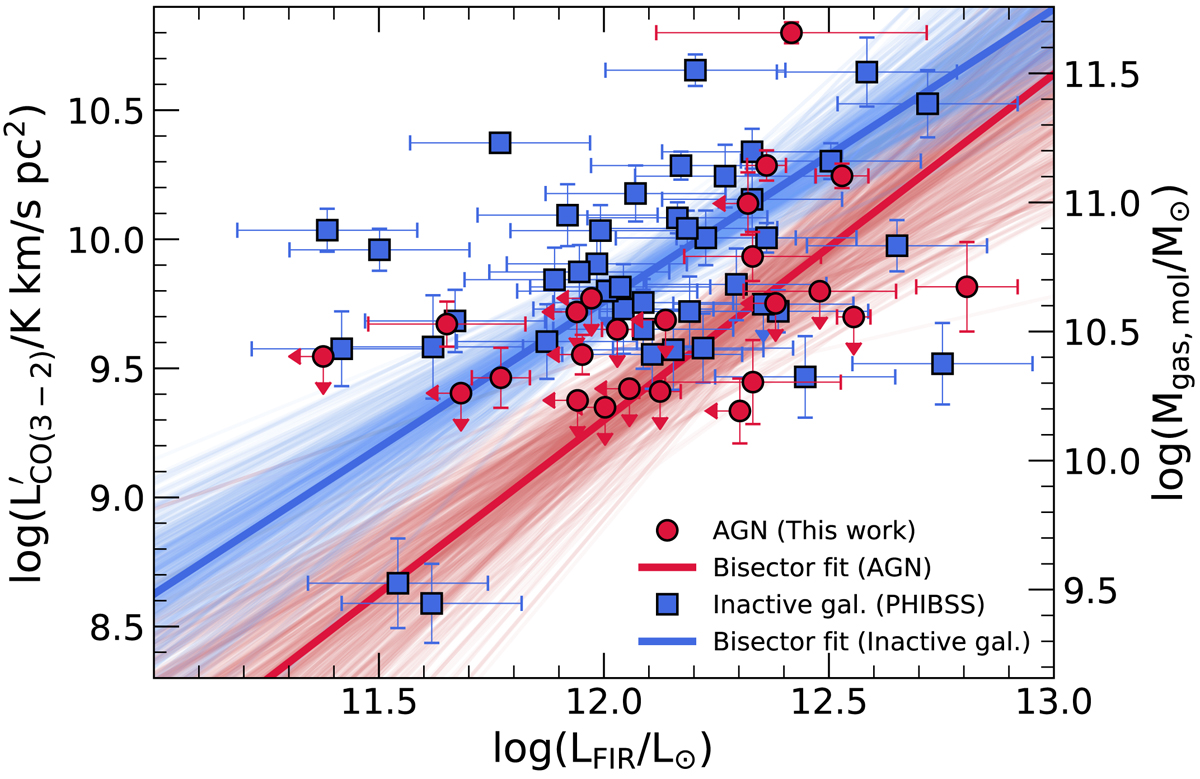
![]() and molecular gas masses as a function of LFIR for our AGN sample (red circles) and inactive galaxies (blue squares; Tacconi et al. 2018). To display the distribution of the two samples in the plot, we performed a bisector fit by adopting a Bayesian framework (see text). The dispersion of the fits is given by plotting 500 realizations of the bisector fit. Where the fits are better constrained (log LFIR/L⊙ = 12.2) AGN show CO luminosities 0.43 dex lower than inactive galaxies at the ∼2σ level.
and molecular gas masses as a function of LFIR for our AGN sample (red circles) and inactive galaxies (blue squares; Tacconi et al. 2018). To display the distribution of the two samples in the plot, we performed a bisector fit by adopting a Bayesian framework (see text). The dispersion of the fits is given by plotting 500 realizations of the bisector fit. Where the fits are better constrained (log LFIR/L⊙ = 12.2) AGN show CO luminosities 0.43 dex lower than inactive galaxies at the ∼2σ level.
Current usage metrics show cumulative count of Article Views (full-text article views including HTML views, PDF and ePub downloads, according to the available data) and Abstracts Views on Vision4Press platform.
Data correspond to usage on the plateform after 2015. The current usage metrics is available 48-96 hours after online publication and is updated daily on week days.
Initial download of the metrics may take a while.