Fig. 1.
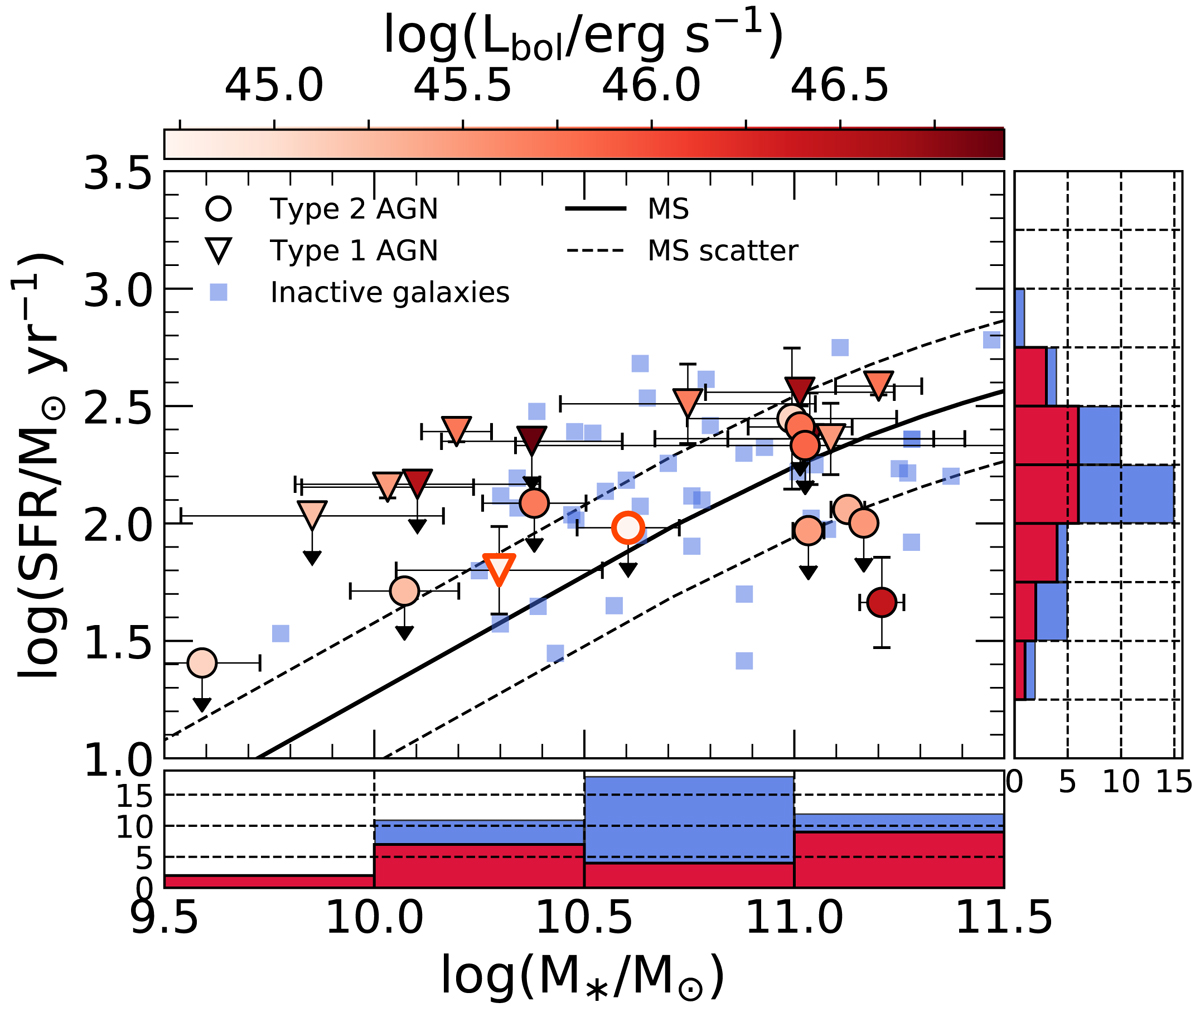
Distribution of host galaxy properties in the SFR-M* plane for the 21 AGN (type 1s marked by triangles and type 2s marked by circles) in our sample with an estimate of both stellar mass and SFR. The comparison sample of inactive galaxies is depicted by blue squares. The two data points with orange edges represent the targets with SFR derived through modeling of the stellar emission using SED fitting. Black arrows represent 3σ upper limits. The color coding indicates the AGN bolometric luminosity for our sample, which covers two orders of magnitude in Lbol. The black solid line reproduces the main sequence of star-forming galaxies from Schreiber et al. (2015) at the average redshift of our target sample (i.e., ∼2.3). The dashed lines mark the scatter of the main sequence (equal to 0.3 dex). The histograms show the projected distribution of the two quantities along each axis, in red for our sample and blue for the comparison one.
Current usage metrics show cumulative count of Article Views (full-text article views including HTML views, PDF and ePub downloads, according to the available data) and Abstracts Views on Vision4Press platform.
Data correspond to usage on the plateform after 2015. The current usage metrics is available 48-96 hours after online publication and is updated daily on week days.
Initial download of the metrics may take a while.