Fig. 8.
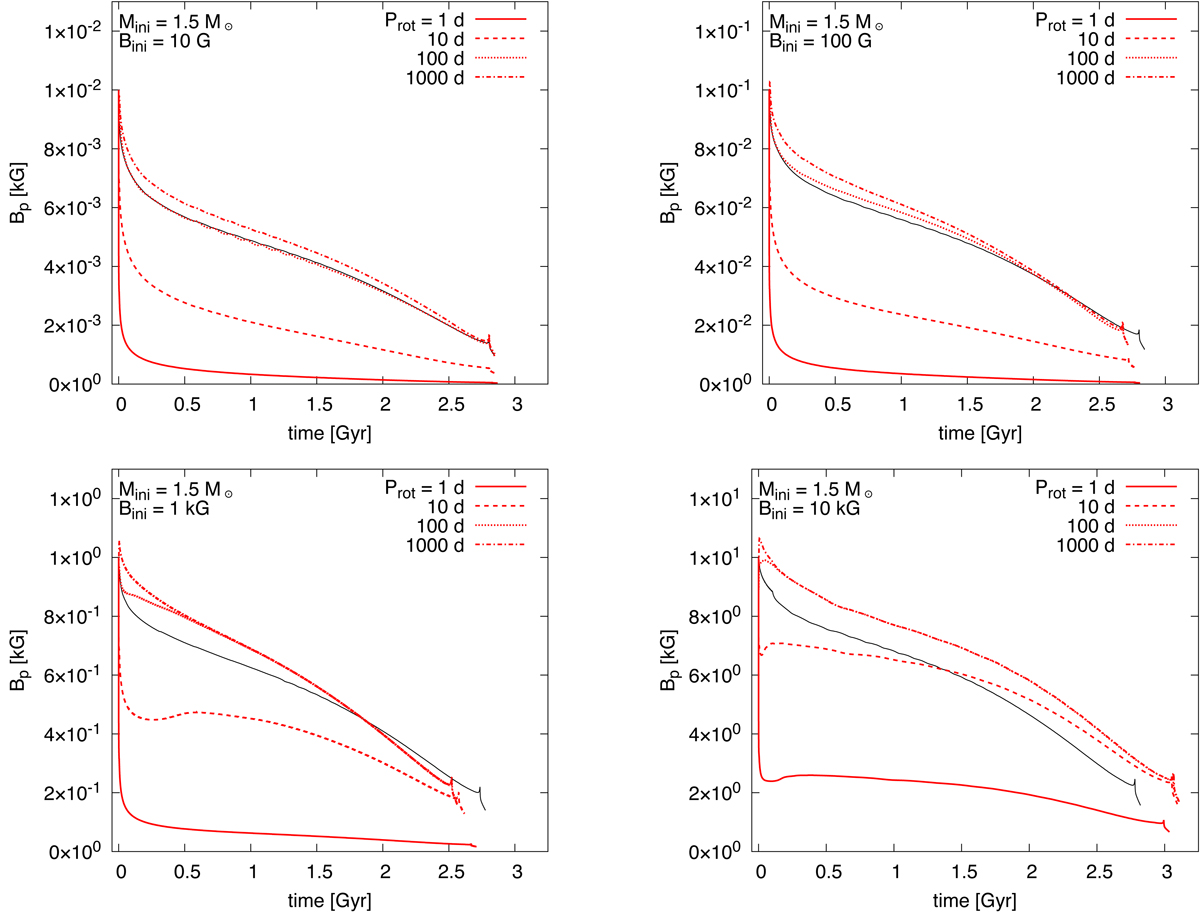
Evolution of the polar surface magnetic field strength as a function of time for the same models as those shown in Fig. 7. Models with Prot, ini = 1, 10, 100, and 1000 d correspond to red solid, dashed, dotted, and dash-dotted lines, respectively. Models with Bp, ini = 10 G are shown in the top left panel, those with Bp, ini = 100, 1000, and 10 000 G are, respectively, shown in the top-right, bottom-left, and bottom-right panels. The black solid lines depict models without the η effect with Prot, ini = 1000 d for each initial magnetic field strength.
Current usage metrics show cumulative count of Article Views (full-text article views including HTML views, PDF and ePub downloads, according to the available data) and Abstracts Views on Vision4Press platform.
Data correspond to usage on the plateform after 2015. The current usage metrics is available 48-96 hours after online publication and is updated daily on week days.
Initial download of the metrics may take a while.