Fig. 7.
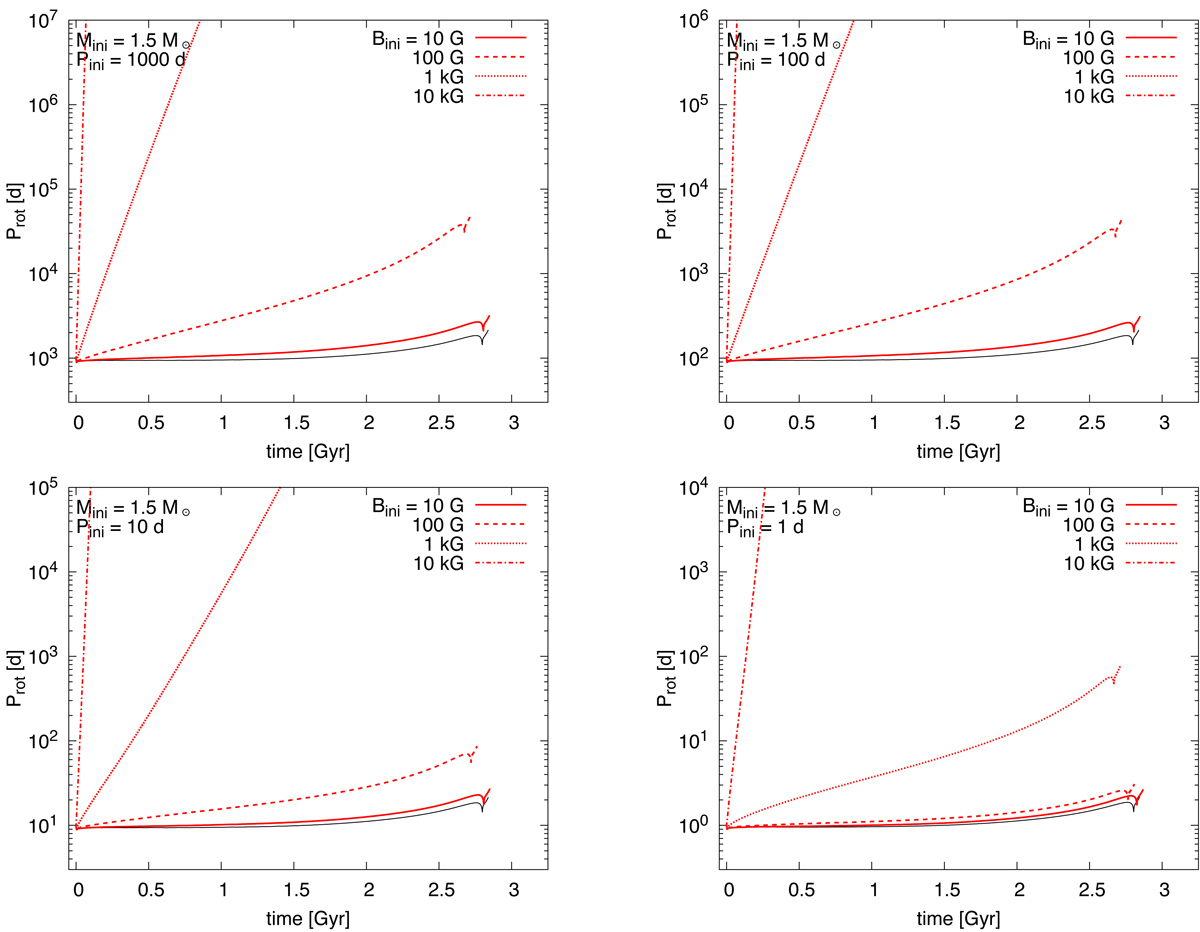
Evolution of the surface rotation periods as a function of time during core hydrogen burning for our 1.5 M⊙ models. Models with Bp, ini = 10, 100, 1000, and 10 000 G are shown by red solid, dashed, dotted, and dash-dotted lines, respectively. Models with Prot, ini = 1000, 100, 10, and 1 d are shown in the top-left, top-right, bottom-left, and bottom-right panels, respectively. The solid black lines correspond to models without stellar wind mass loss and with Bp, ini = 10 G for each initial rotation period.
Current usage metrics show cumulative count of Article Views (full-text article views including HTML views, PDF and ePub downloads, according to the available data) and Abstracts Views on Vision4Press platform.
Data correspond to usage on the plateform after 2015. The current usage metrics is available 48-96 hours after online publication and is updated daily on week days.
Initial download of the metrics may take a while.