Fig. 12.
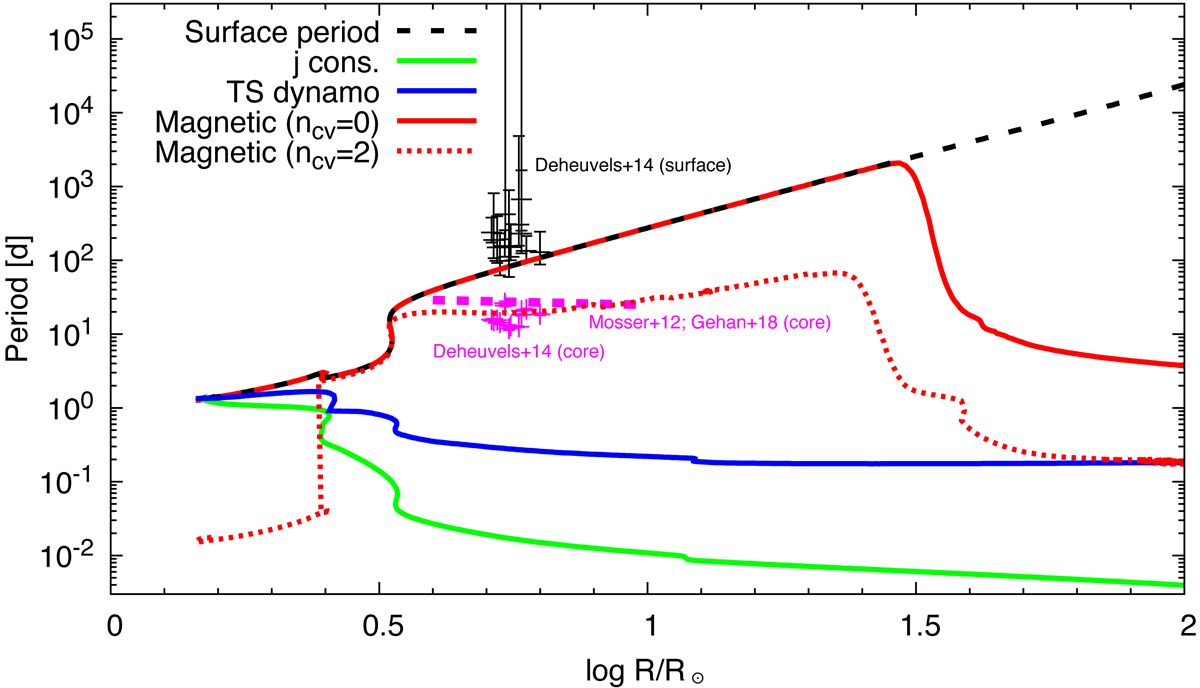
Rotation period at the surface (black dashed line) and near the center (red line) of our fiducial 1.5 M⊙ model (ncv = 0) as function of its radius. The central rotation period of a similar model with ncv = 2 is shown by the red dotted line. For comparison, the central rotation periods of models with no angular momentum transfer (green line) and with transfer due to the Tayler–Spruit dynamo (blue line) are also shown. Theoretical models are compared with the results of asteroseismic observations. Core rotation periods obtained by asteroseismic observations (Mosser et al. 2012; Gehan et al. 2018) are shown by the magenta dashed line. Surface and core periods obtained by Deheuvels et al. (2014) are shown by black and magenta pluses.
Current usage metrics show cumulative count of Article Views (full-text article views including HTML views, PDF and ePub downloads, according to the available data) and Abstracts Views on Vision4Press platform.
Data correspond to usage on the plateform after 2015. The current usage metrics is available 48-96 hours after online publication and is updated daily on week days.
Initial download of the metrics may take a while.