Fig. 9.
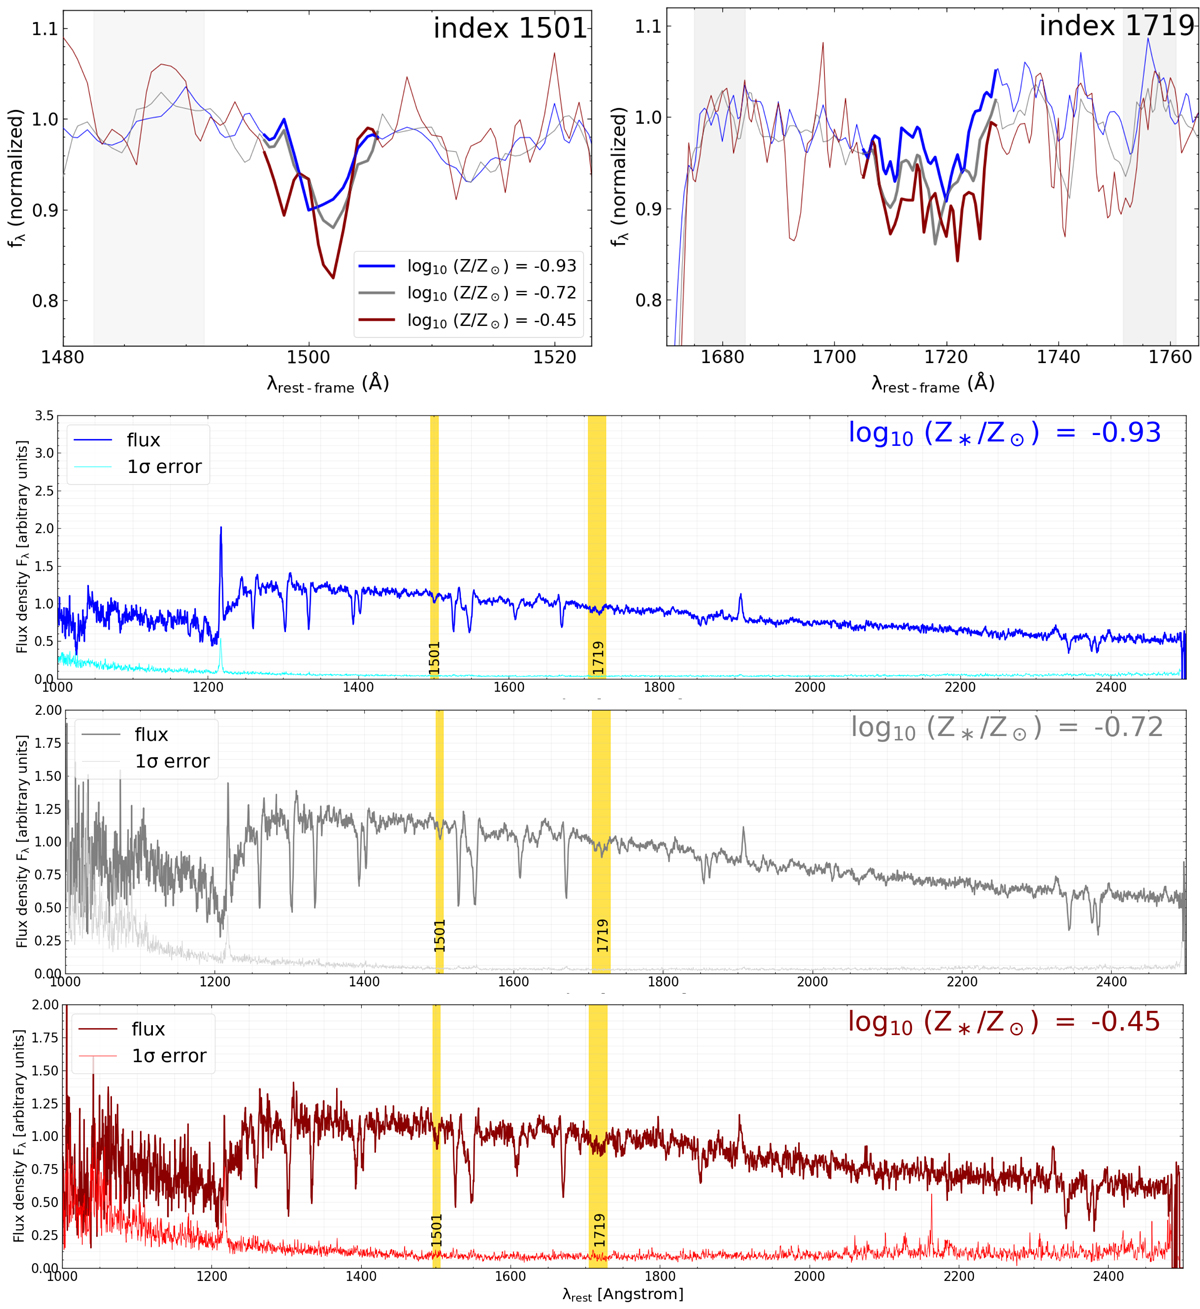
Stacked spectra between 1000 and 2500 Å in three bins of increasing βmedian: −1.98 (blue line), −1.51 (gray line), and −1.10 (red line; see also Table 3). The absorption complexes used in this work to estimate the metallicity, located at 1501 and 1719 Å, are highlighted with yellow vertical bands. Top two panels: three stacks are plotted together, and we zoom-in around the two metallicity indexes. A thicker line specifies both the width of each absorption complex, while shaded gray areas indicate the spectral ranges for the estimation of the pseudo-continuum. Spectral stacks of galaxies with redder UV slopes have deeper absorption features, hence higher metallicity.
Current usage metrics show cumulative count of Article Views (full-text article views including HTML views, PDF and ePub downloads, according to the available data) and Abstracts Views on Vision4Press platform.
Data correspond to usage on the plateform after 2015. The current usage metrics is available 48-96 hours after online publication and is updated daily on week days.
Initial download of the metrics may take a while.