Fig. 6.
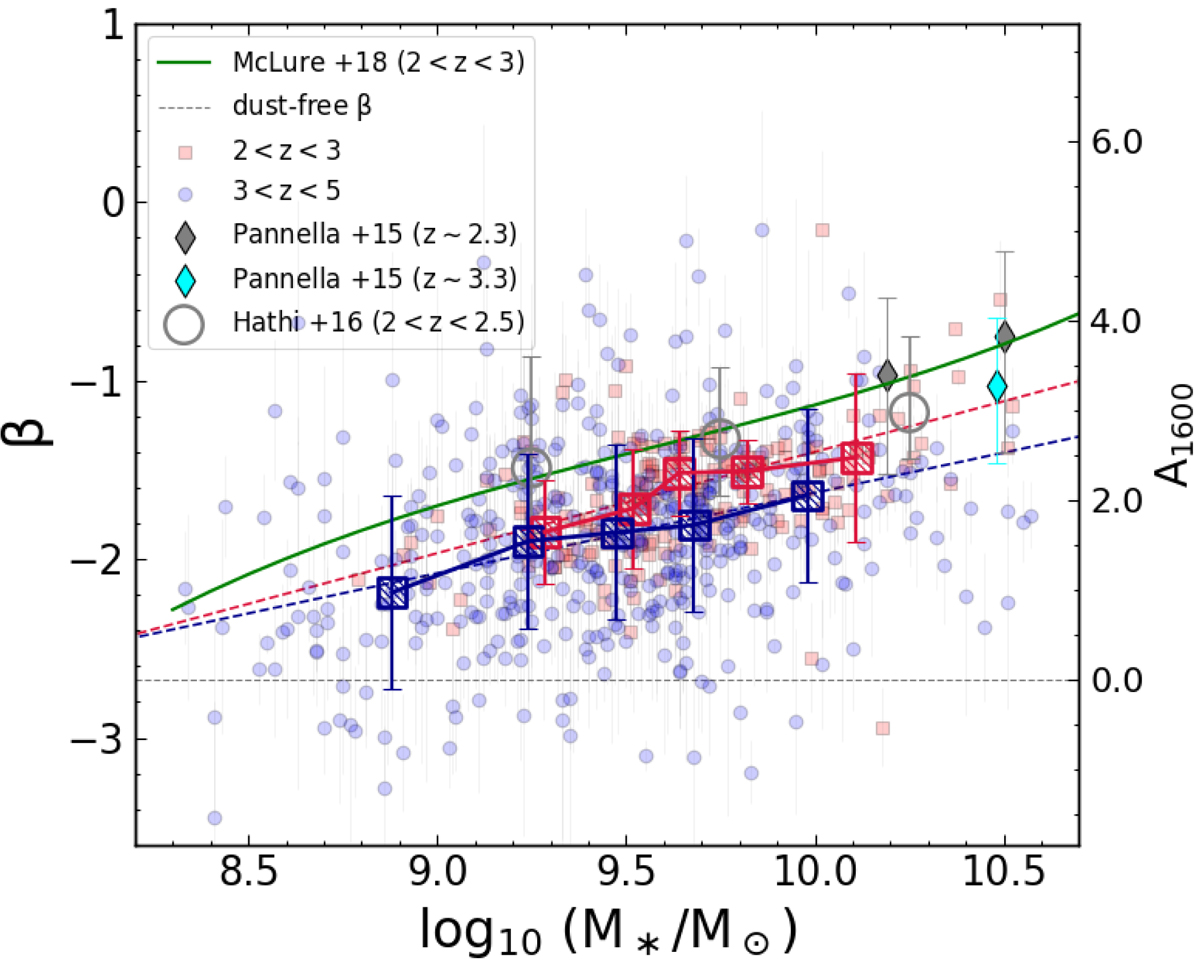
UV slope as a function of stellar mass in two redshift bins: 2 < z < 3.5 and 3.5 < z < 5 (red and blue, respectively), where 3.5 is the median redshift of VANDELS. A linear fit to the relations in each redshift bin is also shown via dashed lines with their corresponding colors. The M*–β relation from McLure et al. (2018a) at z < 3 is shown with a green line for comparison, while gray and cyan diamonds come from Pannella et al. (2015). On the left y-axis, A1600 is shown using the β–A1600 conversion of Meurer et al. (1999).
Current usage metrics show cumulative count of Article Views (full-text article views including HTML views, PDF and ePub downloads, according to the available data) and Abstracts Views on Vision4Press platform.
Data correspond to usage on the plateform after 2015. The current usage metrics is available 48-96 hours after online publication and is updated daily on week days.
Initial download of the metrics may take a while.