Fig. 5.
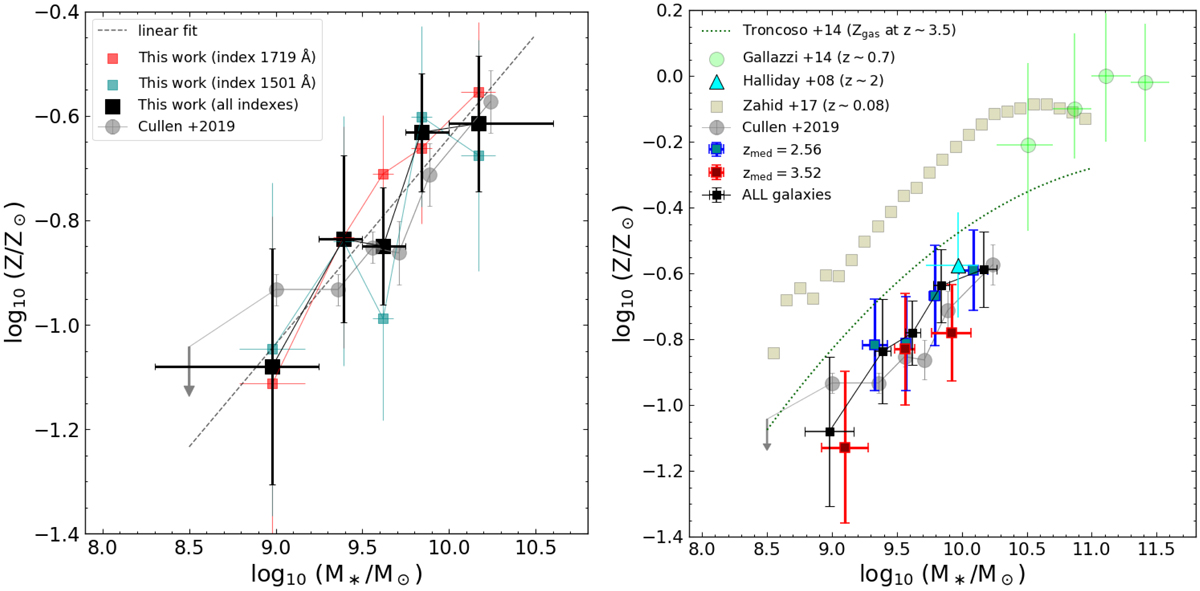
Left: mass-metallicity relation of star-forming galaxies in VANDELS, with median stacks in bins of stellar mass (black squares). The metallicities derived from single indexes (i.e., in order, 1550, 1719, and 1501 Å) are drawn with pale colored squares in blue, red, and dark cyan, respectively. The linear fit to the median metallicities in the 108.5 < M* < 1010.5 M⊙ range is highlighted with a dashed dark cyan line. Right: mass-metallicity relation followed by VANDELS star-forming galaxies at redshift < 3 (dark cyan squares) and > 3 (dark red squares). The median redshifts of the two subsets are 2.58 and 3.54, respectively. The relation for all the sample is overplotted in black. In both diagrams, the relation by Cullen et al. (2019), calculated at the same median redshift of our work (and of the VANDELS survey), is displayed with gray filled circles, while in the bottom panel we also include the MZR found by Zahid et al. (2017) at z ∼ 0.08 from the SDSS survey (olive squares) and by Gallazzi et al. (2014) for massive star-forming galaxies (M* > 1010.2 M⊙) at z ∼ 0.7. The linear fit to the MZR in the lower and higher redshift bin is drawn with a shaded dashed line in the corresponding color. The representative M* and metallicity estimated from the spectral stack of 75 star-forming galaxies at redshift ∼2 from Halliday et al. (2008) is shown with a cyan square and error bars. Finally, the stellar-mass gas-phase metallicity relation for star-forming galaxies at z ∼ 3.5 (Troncoso et al. 2014) is drawn with a green dashed line.
Current usage metrics show cumulative count of Article Views (full-text article views including HTML views, PDF and ePub downloads, according to the available data) and Abstracts Views on Vision4Press platform.
Data correspond to usage on the plateform after 2015. The current usage metrics is available 48-96 hours after online publication and is updated daily on week days.
Initial download of the metrics may take a while.