Fig. 2.
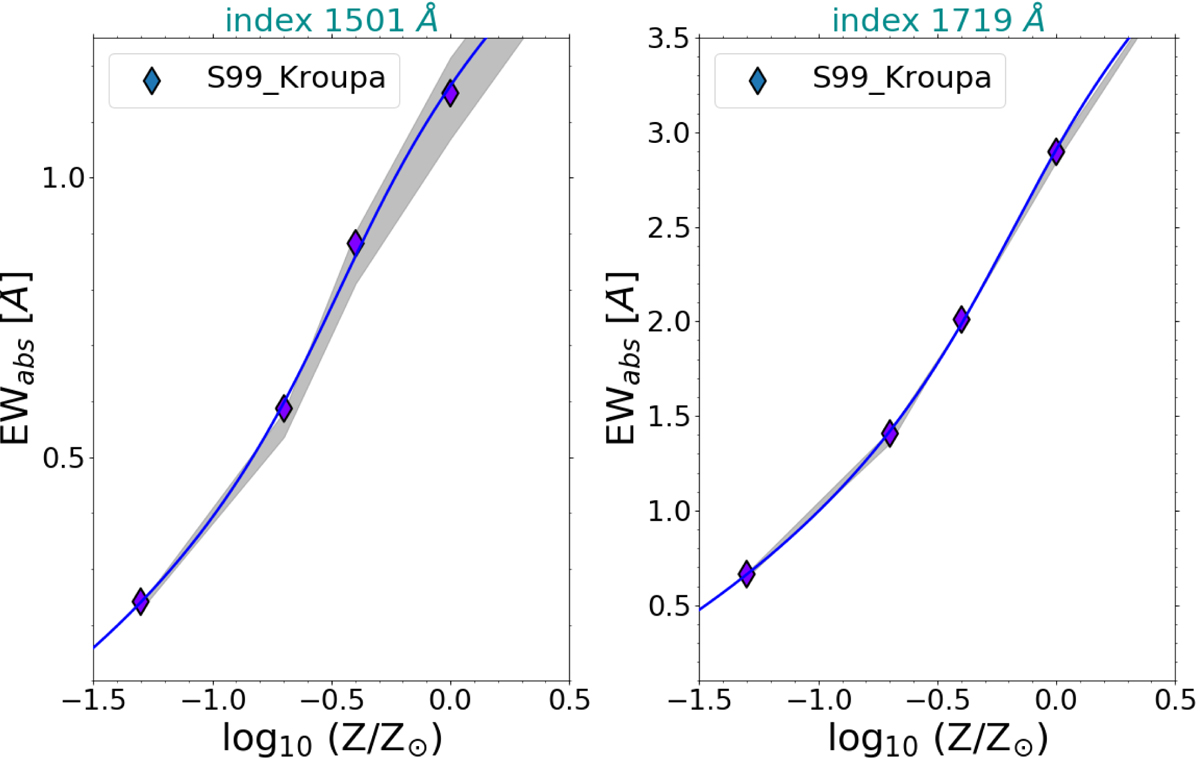
Diagrams showing dependence between EW and metallicity for the 1501 and 1719 Å absorption line indexes that we adopt in this paper according to Starburst99 models. All the data points are derived assuming a constant SFH for 100 Myr and Kroupa IMF. The shaded gray region around the main relations represents the variation of EW with the IMF (Kroupa-Salpeter) and with the ages of the stellar population chosen (50 Myr–2 Gyr), as described in the text. The final metallicity calibrations are based on a third-order polynomial fit to the data points, and are shown with a continuous blue line in each panel. Their explicit forms are given in the text in Eqs. (2) and (3).
Current usage metrics show cumulative count of Article Views (full-text article views including HTML views, PDF and ePub downloads, according to the available data) and Abstracts Views on Vision4Press platform.
Data correspond to usage on the plateform after 2015. The current usage metrics is available 48-96 hours after online publication and is updated daily on week days.
Initial download of the metrics may take a while.