Fig. 9.
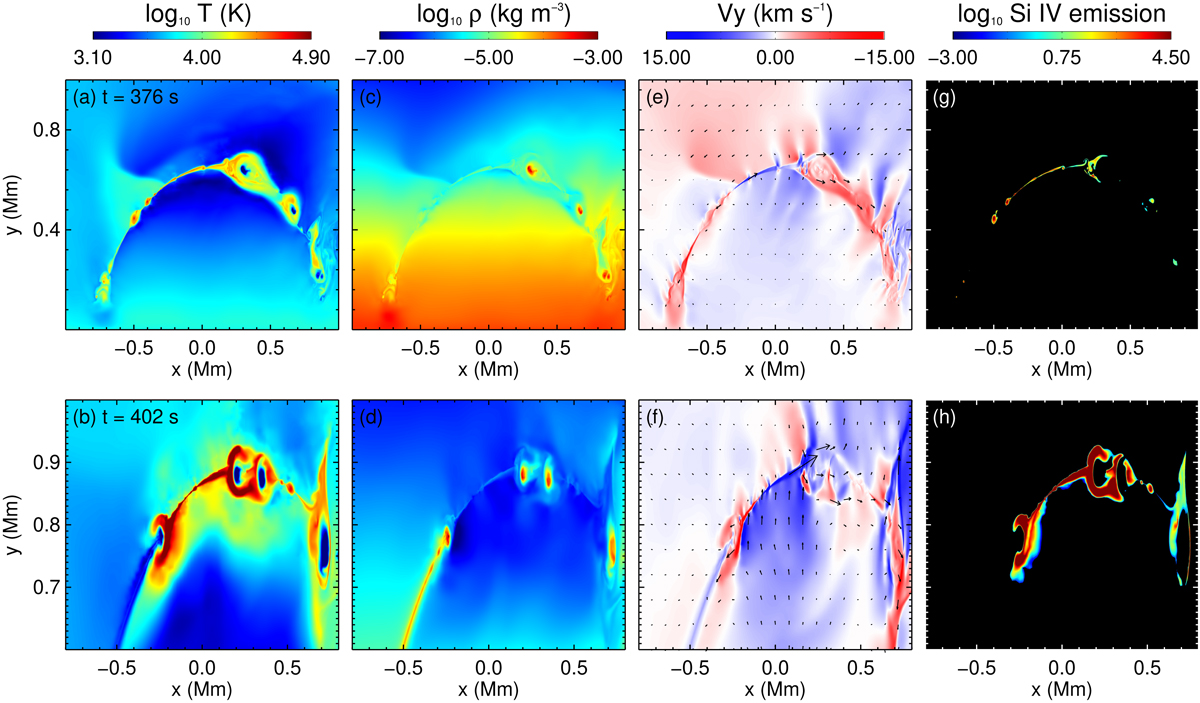
Comparisons of the main current sheet region in Cases 3 (top panels) and 5 (bottom panels) at the times when the plasmoid instability is well developed. The distributions of temperature (panels a and b), density (panels c and d), vertical velocity Vy (panels d and f) are shown, along with the synthetic Si IV 1394 Å line emission at each grid point (panels g and h). The black arrows in panels e and f represent the total velocity. The background magnetic fields are 500 G and 600 G in Cases 3 and 5, respectively. The amount of emerging flux in Case 5 is greater than that in Case 3. The heat conduction and ambipolar diffusion effects are not included in Case 5. Panels g and h are shown in arbitrary units.
Current usage metrics show cumulative count of Article Views (full-text article views including HTML views, PDF and ePub downloads, according to the available data) and Abstracts Views on Vision4Press platform.
Data correspond to usage on the plateform after 2015. The current usage metrics is available 48-96 hours after online publication and is updated daily on week days.
Initial download of the metrics may take a while.