Fig. 7.
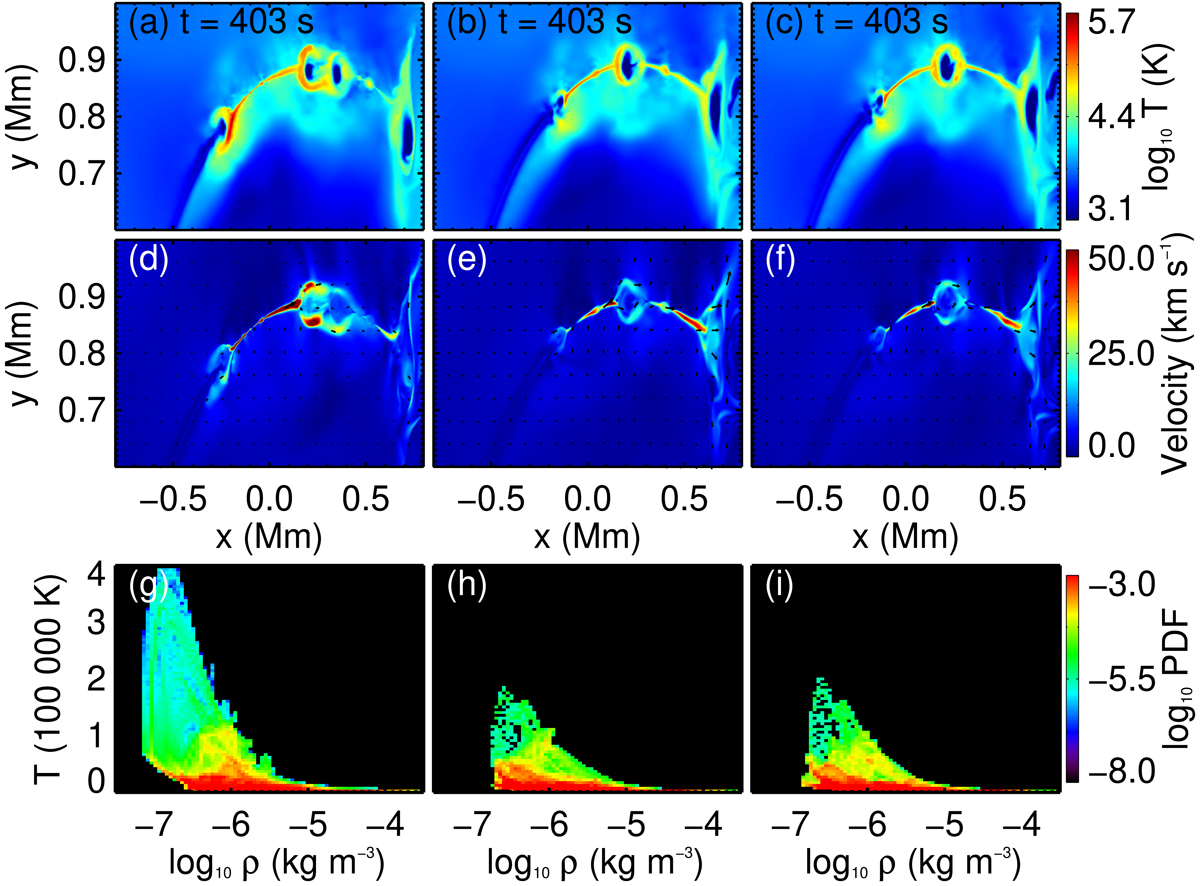
Comparisons among three different cases. The distributions of temperature (panels a–c), total velocity the in x − y plane (![]() ) (panels d–f), and the joint PDF of temperature and density (panels g–i) are presented. Panels a, d and g are for Case 5, panels b, e and h are for Case 5a, and panels c, f and i are for Case 5b. The maximum AMR refinement levels in Case 5, 5a, and 5b are 5, 3, and 3, respectively. The ambipolar diffusion effect is not included in Case 5 and 5a, but it is included in Case 5b.
) (panels d–f), and the joint PDF of temperature and density (panels g–i) are presented. Panels a, d and g are for Case 5, panels b, e and h are for Case 5a, and panels c, f and i are for Case 5b. The maximum AMR refinement levels in Case 5, 5a, and 5b are 5, 3, and 3, respectively. The ambipolar diffusion effect is not included in Case 5 and 5a, but it is included in Case 5b.
Current usage metrics show cumulative count of Article Views (full-text article views including HTML views, PDF and ePub downloads, according to the available data) and Abstracts Views on Vision4Press platform.
Data correspond to usage on the plateform after 2015. The current usage metrics is available 48-96 hours after online publication and is updated daily on week days.
Initial download of the metrics may take a while.