Fig. 5.
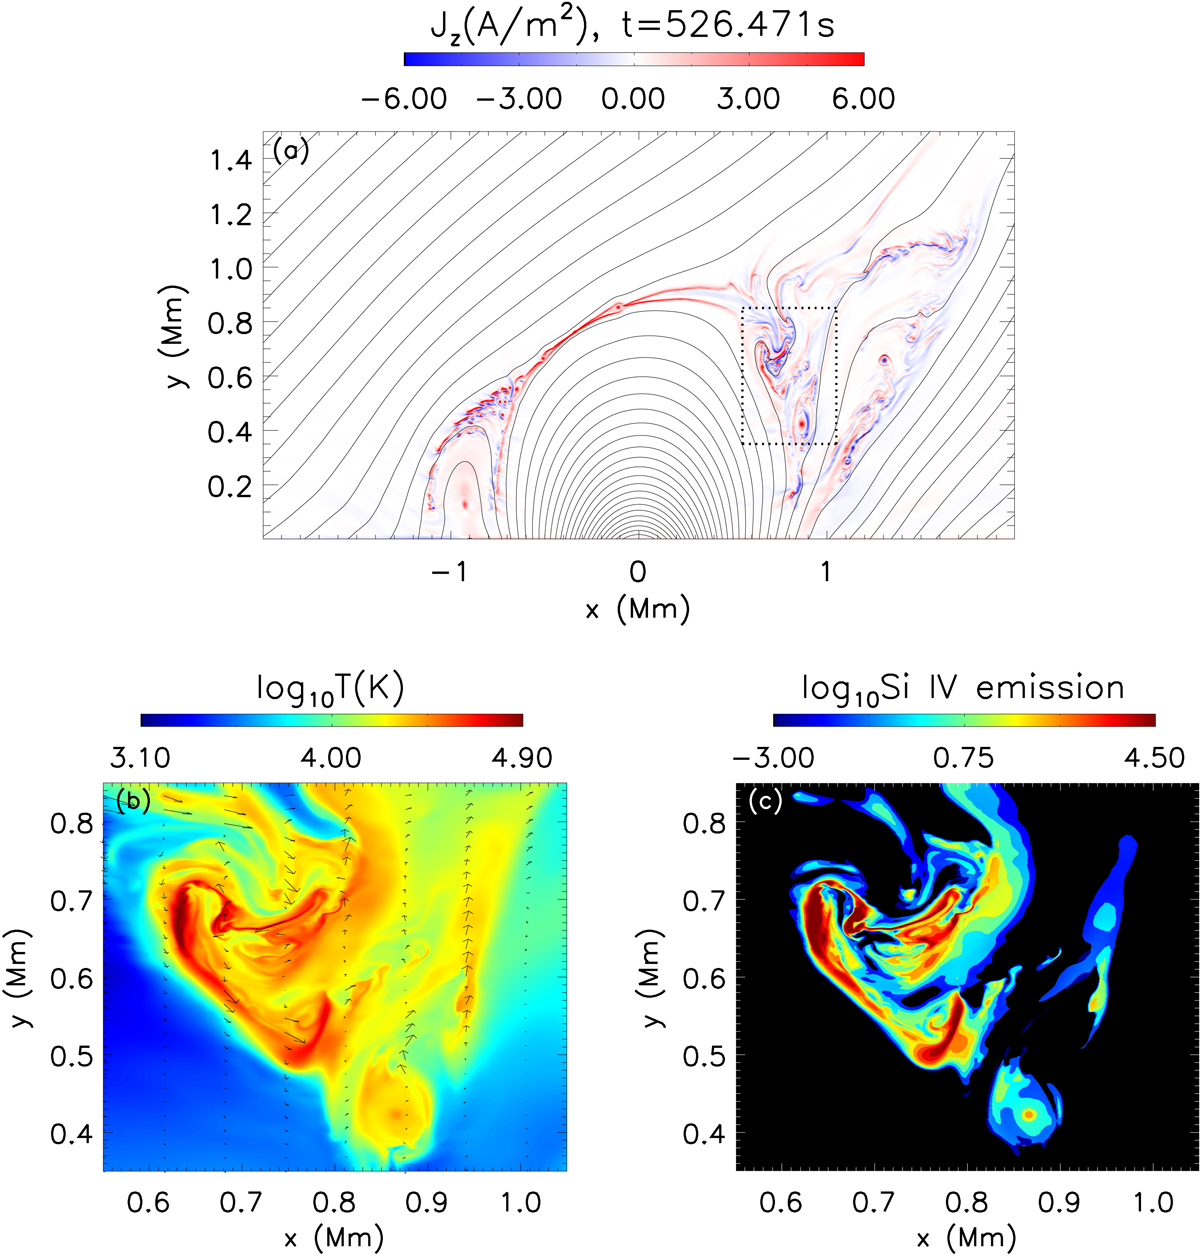
Distributions of the current density in z direction (panel a), temperature (panel b) and the synthetic Si IV 1394 Å line emissions at each grid point (panel c) at a time during the later stage of the reconnection process in Case 3. The domain in panel b and panel c corresponds to the region in the dotted box in panel a. The black arrows in panel b represent the total velocity.
Current usage metrics show cumulative count of Article Views (full-text article views including HTML views, PDF and ePub downloads, according to the available data) and Abstracts Views on Vision4Press platform.
Data correspond to usage on the plateform after 2015. The current usage metrics is available 48-96 hours after online publication and is updated daily on week days.
Initial download of the metrics may take a while.