Fig. 10.
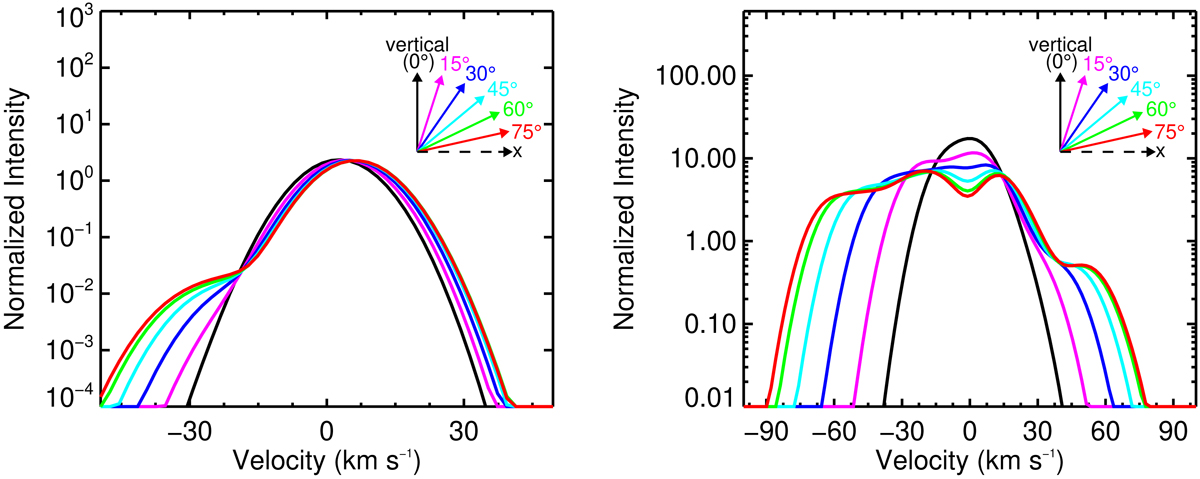
Synthetic Si IV 1394 Å line profiles in Cases 3 and Case 5 taken along different lines of sight (left panel and right panel, respectively). The Si IV line profiles are integral over the whole region shown in the Fig. 9. Black, purple, blue, cyan, green, and red curves represent the line profiles taken along different lines of sight. The angles between the lines of sight and the vertical direction (y-direction) are 0°, 15°, 30°, 45°, 60°, and 75°, respectively. The dashed arrow represents the x-axis of the computation domain, and the solid arrows with different colors indicate the directions of lines of sight taken for calculating the Si IV line profiles shown with the same colors.
Current usage metrics show cumulative count of Article Views (full-text article views including HTML views, PDF and ePub downloads, according to the available data) and Abstracts Views on Vision4Press platform.
Data correspond to usage on the plateform after 2015. The current usage metrics is available 48-96 hours after online publication and is updated daily on week days.
Initial download of the metrics may take a while.