Fig. 7.
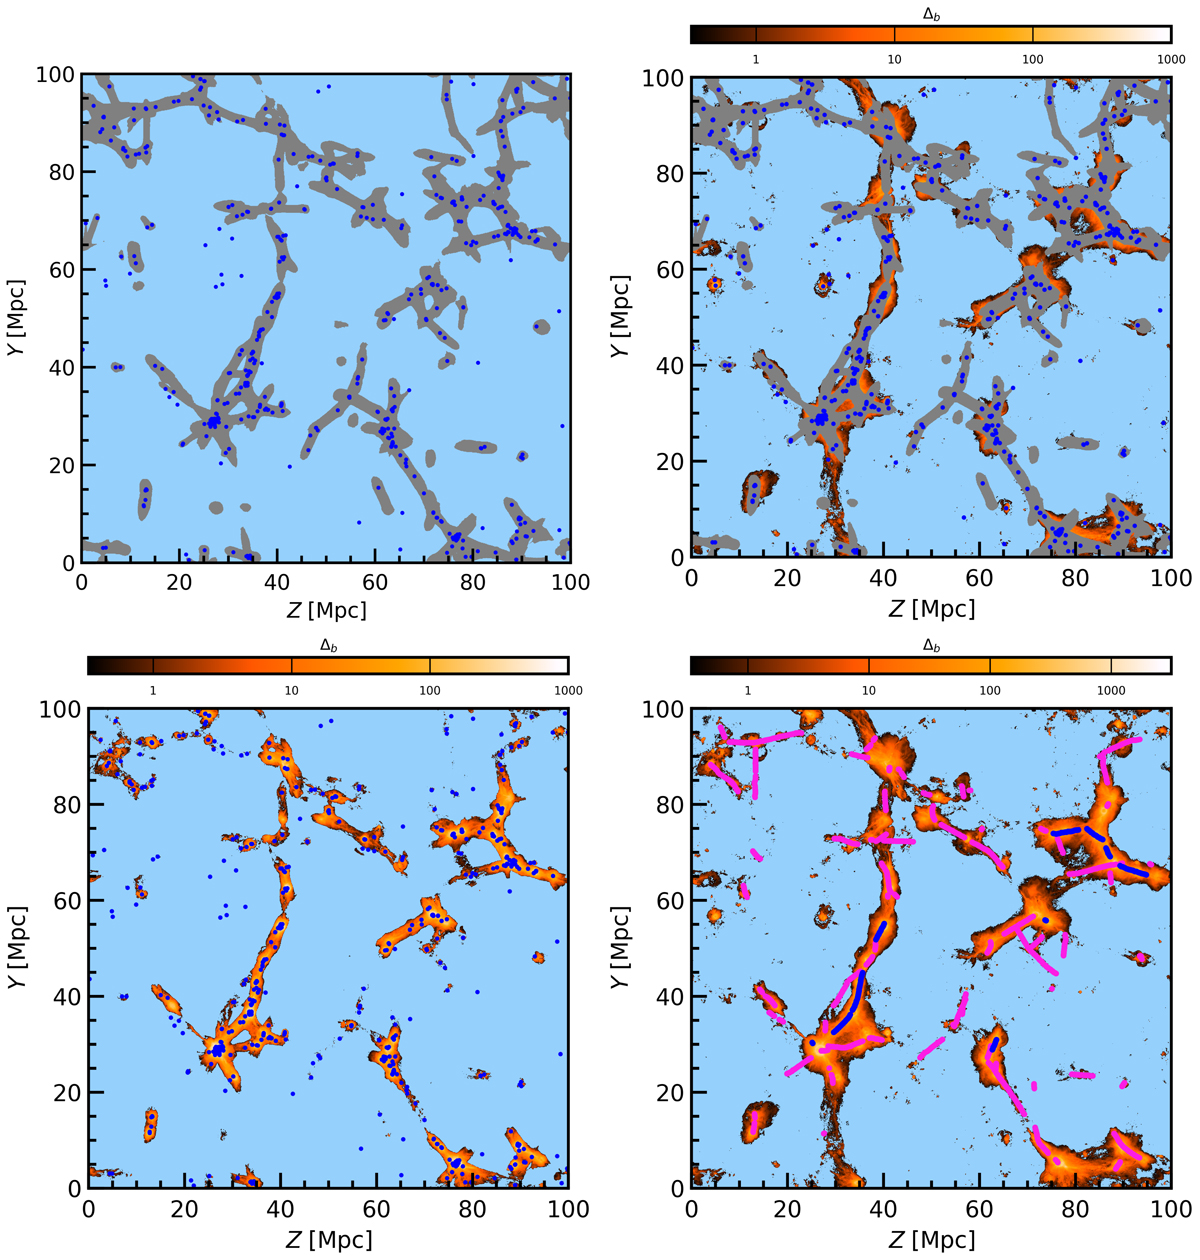
Same slice as in Fig. 1, but for a visualisation of the Bisous formalism. Top left: the galaxies (blue dots) and the visit map ≥0.05 (grey). Top right: the spatial distribution of the missing baryons (colour map) and the filament volumes (grey areas). Bottom left: the spatial distribution of the missing baryons captured with the Bisous filament finder. Bottom right: the spatial distribution of the missing baryons (colour map), the filament spines of our high luminosity overdensity δLD sample (blue), and filaments excluded from the high δLD sample (magenta).
Current usage metrics show cumulative count of Article Views (full-text article views including HTML views, PDF and ePub downloads, according to the available data) and Abstracts Views on Vision4Press platform.
Data correspond to usage on the plateform after 2015. The current usage metrics is available 48-96 hours after online publication and is updated daily on week days.
Initial download of the metrics may take a while.