Fig. 6.
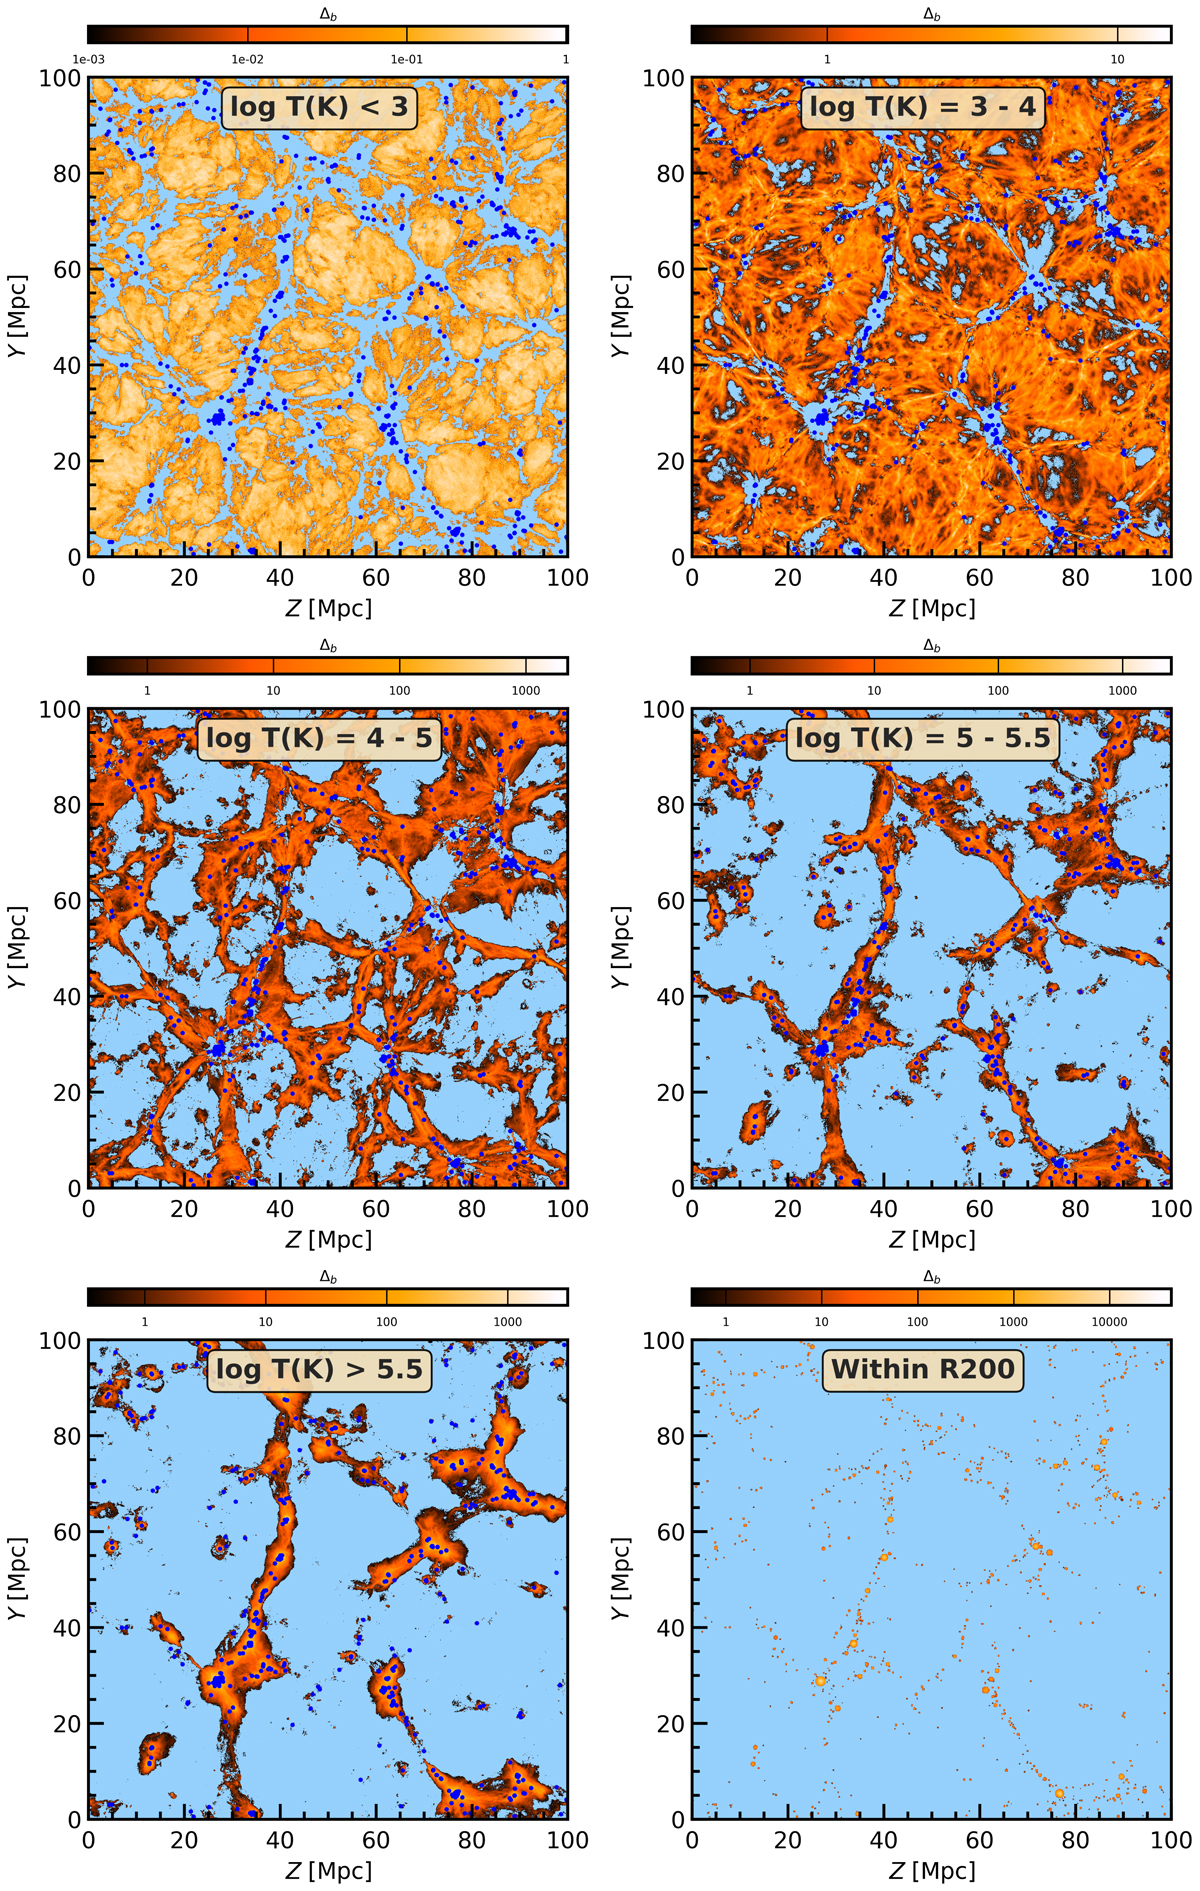
Projected diffuse baryon mass density contrast within the same 5 Mpc slice as Fig. 1, but here in different temperature ranges. Top left: log T(K) < 3. Top right: log T(K) = 3 − 4. Middle left: log T(K) = 4 − 5. Middle right: log T(K) = 5 − 5.5 (the warm WHIM phase). Bottom left: log T(K) > 5.5 (the missing baryon phase). Bottom right: Gas within the virial radii R200 of haloes, excluded from the other panels.
Current usage metrics show cumulative count of Article Views (full-text article views including HTML views, PDF and ePub downloads, according to the available data) and Abstracts Views on Vision4Press platform.
Data correspond to usage on the plateform after 2015. The current usage metrics is available 48-96 hours after online publication and is updated daily on week days.
Initial download of the metrics may take a while.