Free Access
Fig. 5.
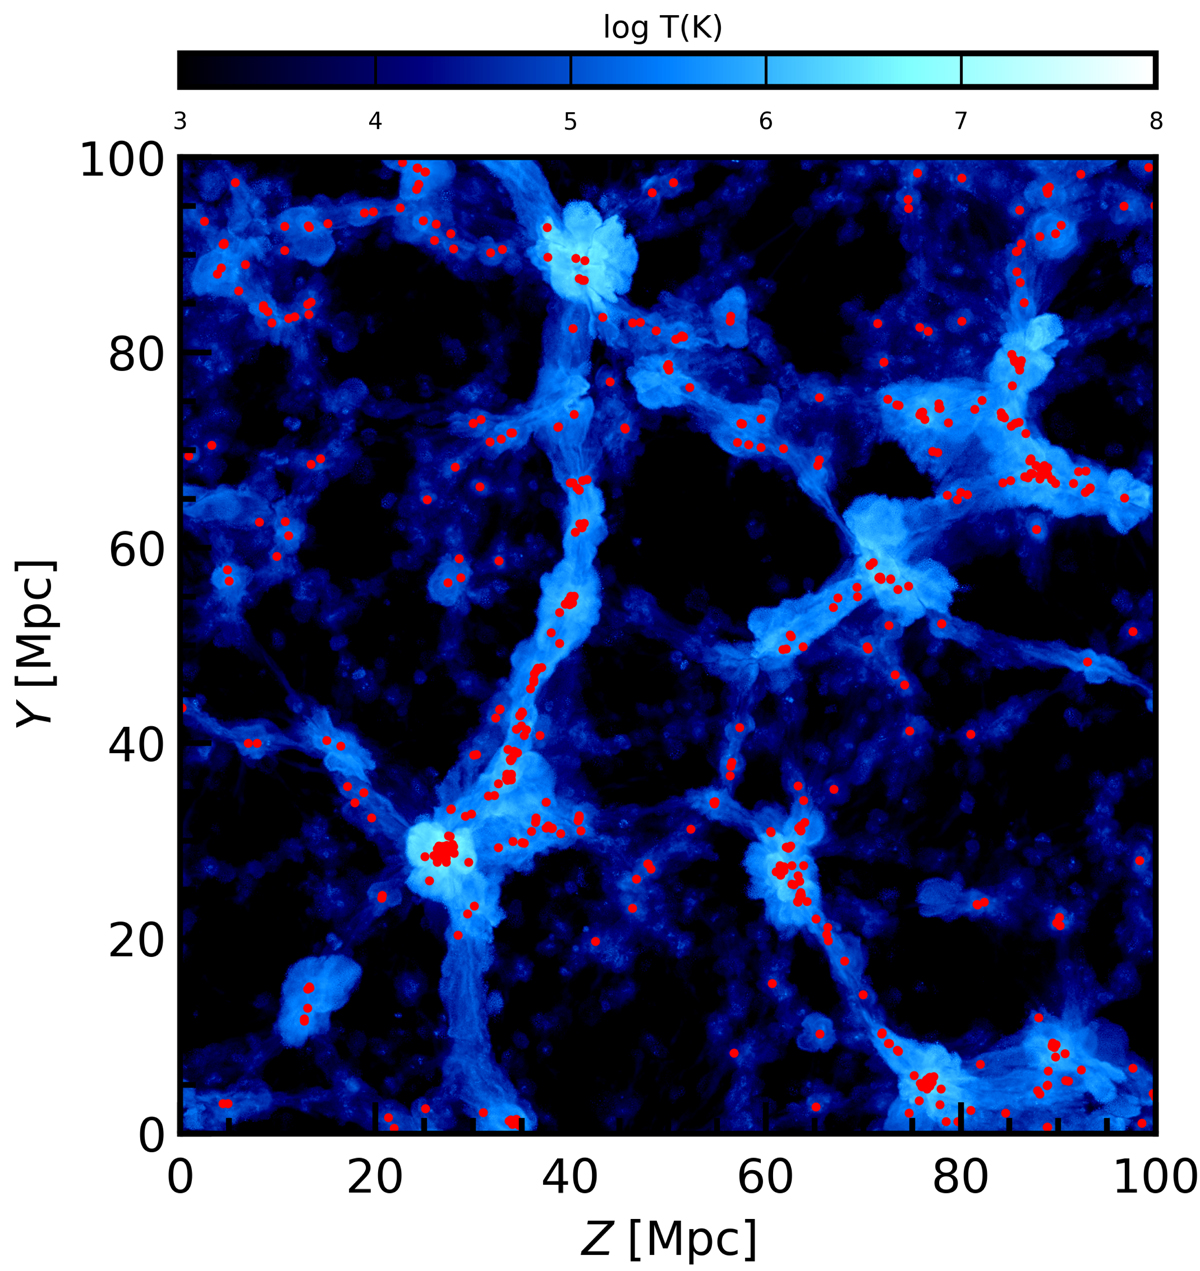
Mass-weighted mean temperature distribution (in shades of blue) of the intergalactic gas (i.e. gas outside R200) within the same slice as Fig. 1. Red dots denote the location of galaxies brighter than Mr = −18.4.
Current usage metrics show cumulative count of Article Views (full-text article views including HTML views, PDF and ePub downloads, according to the available data) and Abstracts Views on Vision4Press platform.
Data correspond to usage on the plateform after 2015. The current usage metrics is available 48-96 hours after online publication and is updated daily on week days.
Initial download of the metrics may take a while.