Fig. 4.
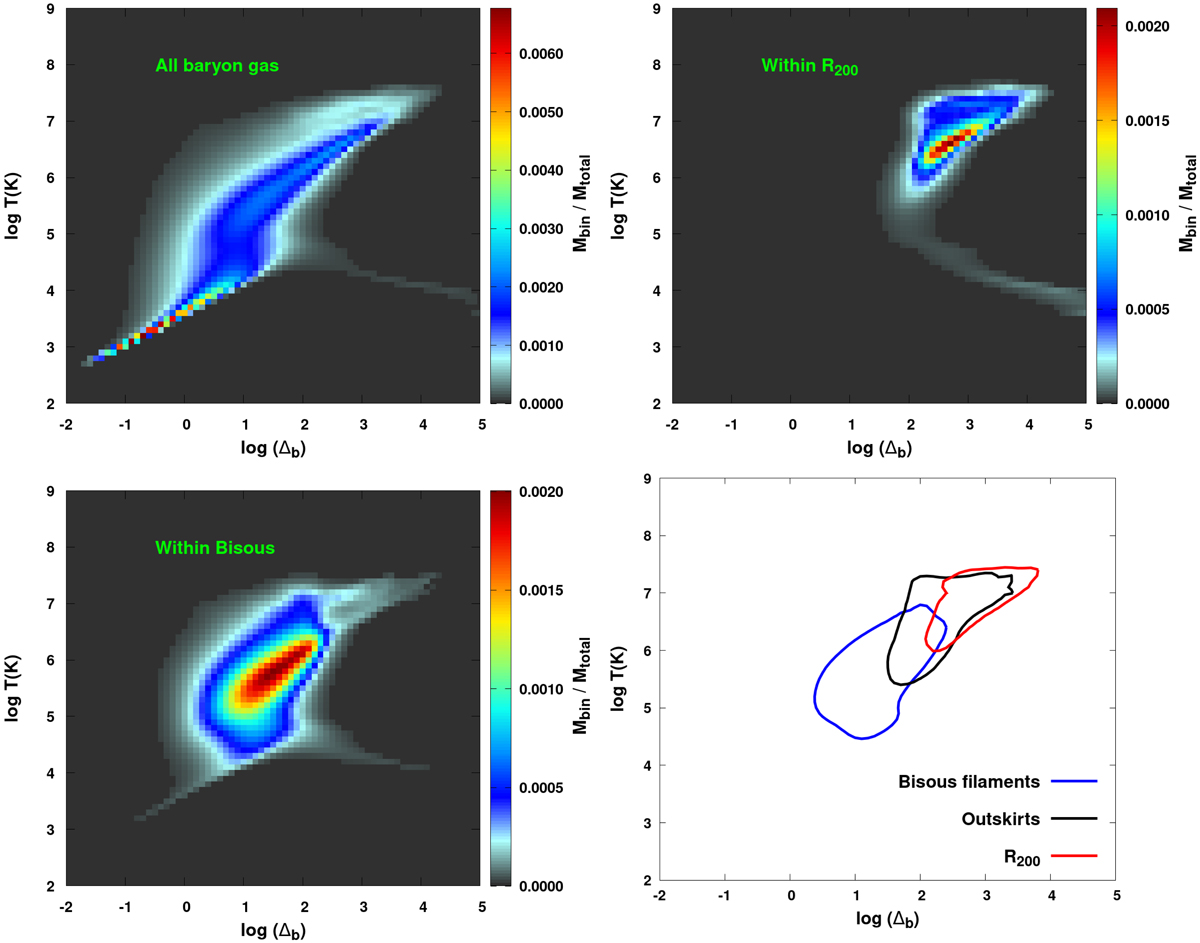
Baryon density contrast – temperature phase diagrams (for the convenience of plotting we use the density contrast Δb = 1 + δb rather than the overdensity δb). All the gas in the full EAGLE volume is shown in the top left panel, the gas within R200 in the top right panel and the gas within the Bisous filaments excluding gas within R200 in the bottom left panel. For each temperature and density bin we co-added the mass of particles and divided by the total mass of the full box. We cut the colour scale at 1% level of the maximum value for clarity. The bottom right panel indicates the isomass curves containing 68% of the baryon mass in Bisous filaments excluding R200 (blue line), within the outskirts (black line), and within R200 (red line). The low-density, low-temperature track seen in the upper left panel corresponds to the photo-heated IGM.
Current usage metrics show cumulative count of Article Views (full-text article views including HTML views, PDF and ePub downloads, according to the available data) and Abstracts Views on Vision4Press platform.
Data correspond to usage on the plateform after 2015. The current usage metrics is available 48-96 hours after online publication and is updated daily on week days.
Initial download of the metrics may take a while.