Fig. 3.
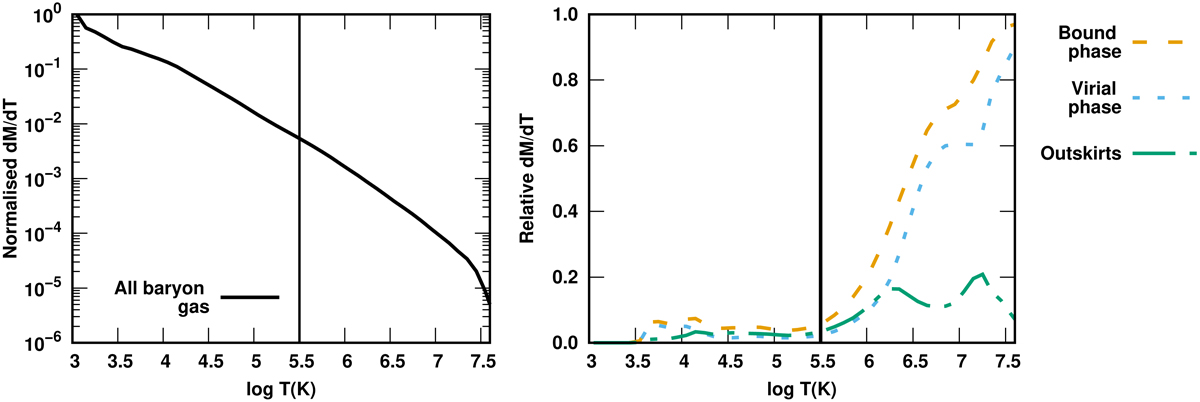
Left panel: distribution of the full EAGLE baryon gas mass content as a function of the temperature, normalised to unity at log T(K) = 3. Right panel: corresponding distributions of different components, relative to the full distribution: the bound phase (orange dashed line), the virial phase within R200 (blue dotted line), and the gas on the outskirts of galaxies and groups of galaxies (outside R200 but within FoF halo, green dash-dotted line). The black vertical line indicates the approximate lower limit for the hot WHIM (i.e. log T(K) = 5.5).
Current usage metrics show cumulative count of Article Views (full-text article views including HTML views, PDF and ePub downloads, according to the available data) and Abstracts Views on Vision4Press platform.
Data correspond to usage on the plateform after 2015. The current usage metrics is available 48-96 hours after online publication and is updated daily on week days.
Initial download of the metrics may take a while.