Fig. 16.
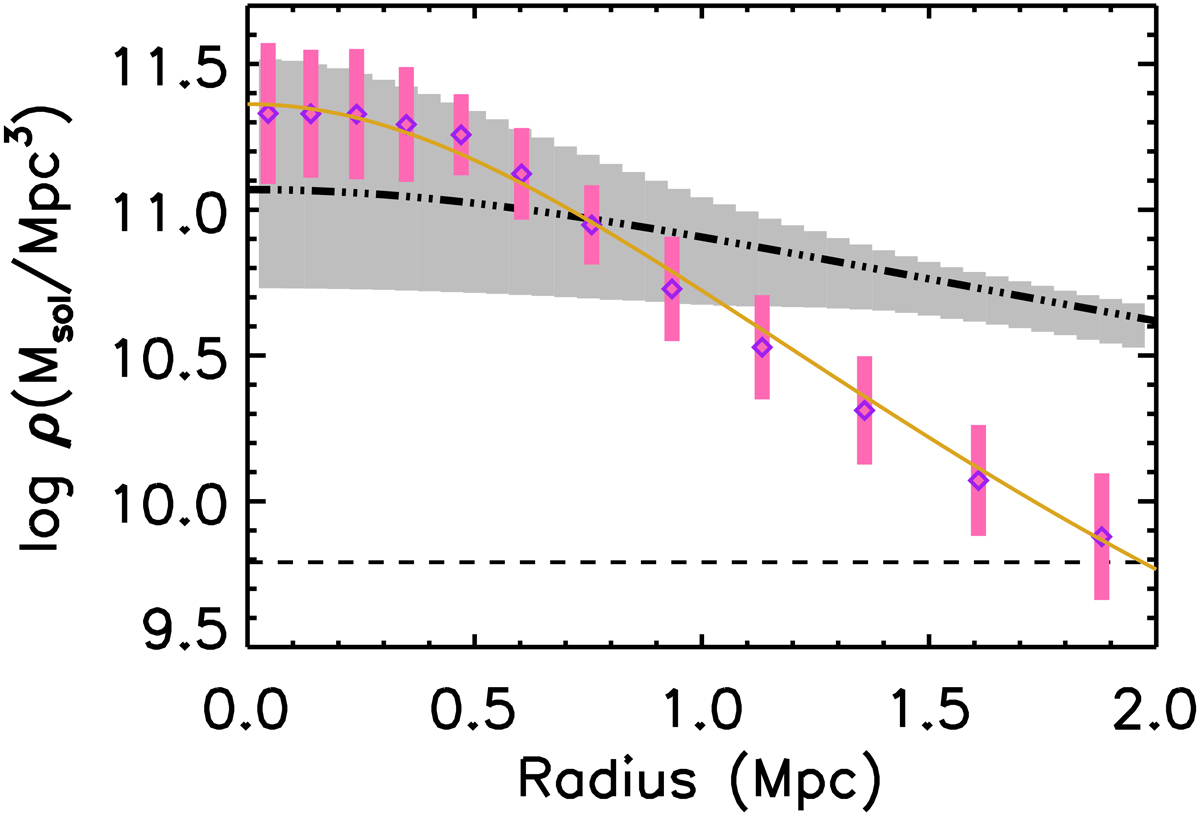
Comparison between the baryon density profile of our high δLD sample (yellow line and pink bars) and the baryon density profile derived by Tanimura et al. (2020) (black dash-dotted line for the best-fit model and grey area for the error). In order to derive their density profile, Tanimura et al. (2020) fitted a beta-model profile to the tSZ and CMB-lensing data observed by Planck. The mean cosmic baryon density is represented by the black dashed line.
Current usage metrics show cumulative count of Article Views (full-text article views including HTML views, PDF and ePub downloads, according to the available data) and Abstracts Views on Vision4Press platform.
Data correspond to usage on the plateform after 2015. The current usage metrics is available 48-96 hours after online publication and is updated daily on week days.
Initial download of the metrics may take a while.