Fig. 15.
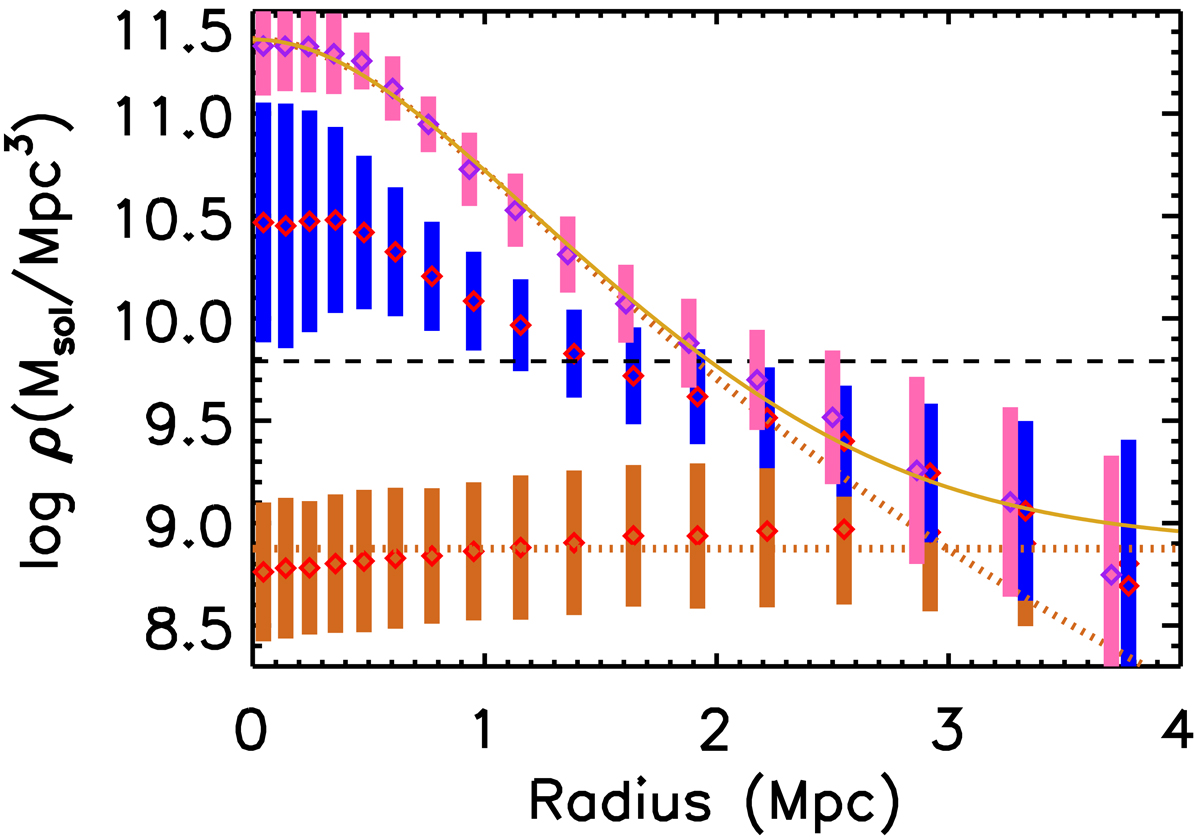
Gas density profile as a function of distance from filament spines. The 1σ interval of the log-normal distribution of individual filament densities at each distance bin for the high δLD, full, and random filament samples is represented by pink, blue, and brown bars, respectively, with the squares indicating the peak of the distribution. The yellow line is the best-fit density profile model of the high δLD sample. The descending brown dotted line is the best-fit density profile model without the effect of the background. The black dashed line indicates the mean cosmic baryon density, while the brown dotted line shows the background level.
Current usage metrics show cumulative count of Article Views (full-text article views including HTML views, PDF and ePub downloads, according to the available data) and Abstracts Views on Vision4Press platform.
Data correspond to usage on the plateform after 2015. The current usage metrics is available 48-96 hours after online publication and is updated daily on week days.
Initial download of the metrics may take a while.