Fig. 14.
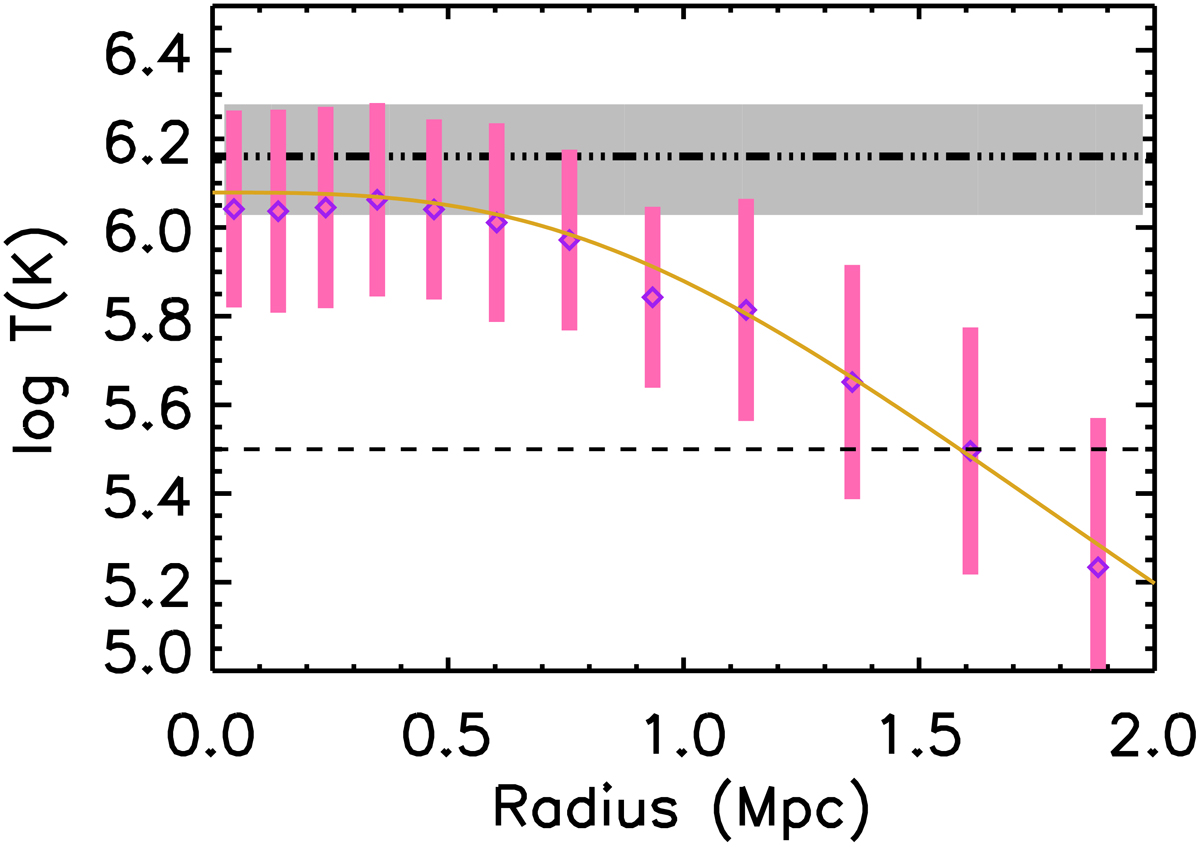
Temperature as a function of distance from the filament spines. The solid yellow line is the best-fit profile for the high δLD sample with its respective distribution indicated by the pink bars (same as in Fig. 13). The black dash-dotted line is the temperature derived by Tanimura et al. (2020) from Planck tSZ and CMB-lensing observations, with the grey area showing the error. The dashed line at log T(K) = 5.5 indicates the lower limit for the hot WHIM.
Current usage metrics show cumulative count of Article Views (full-text article views including HTML views, PDF and ePub downloads, according to the available data) and Abstracts Views on Vision4Press platform.
Data correspond to usage on the plateform after 2015. The current usage metrics is available 48-96 hours after online publication and is updated daily on week days.
Initial download of the metrics may take a while.