Fig. 11.
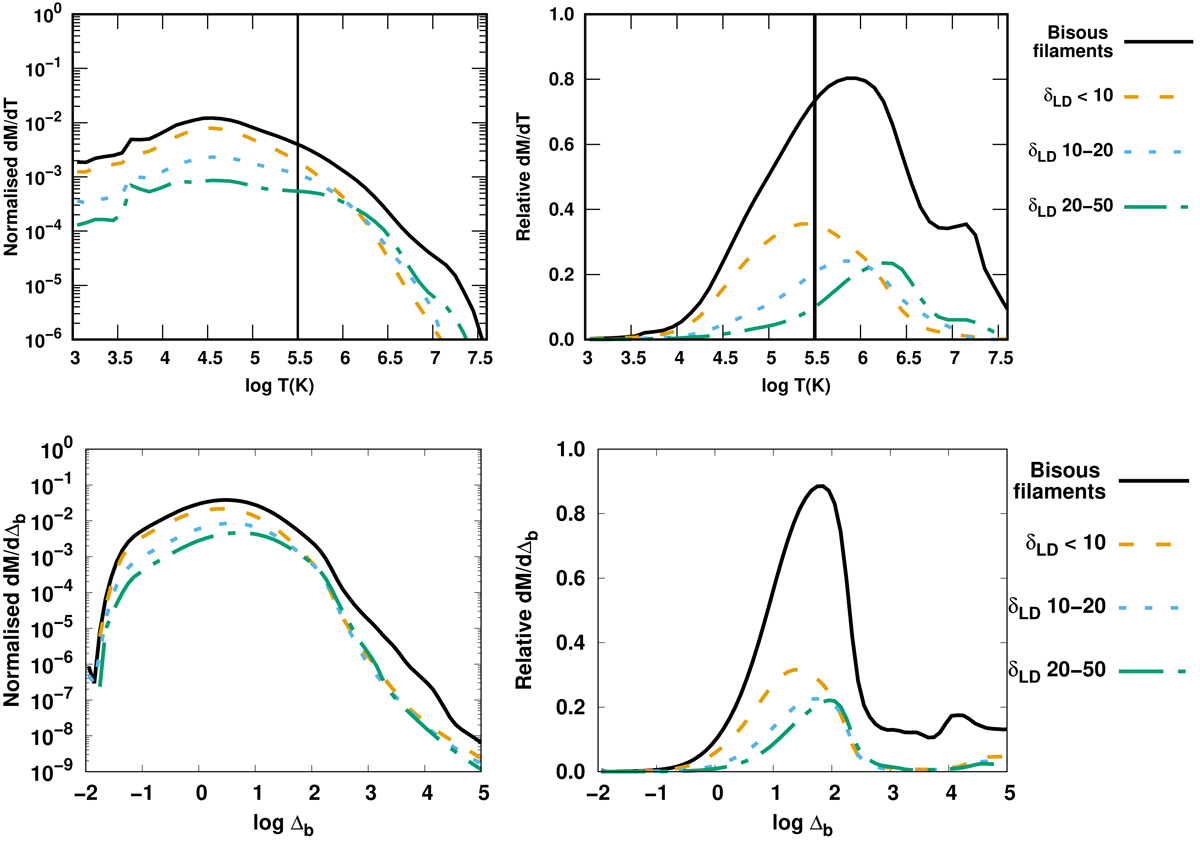
Top: absolute (left panel, normalised to unity at the maximum value of the full baryon sample, left panel in Fig. 3) and relative distributions (right panel) of the baryon gas mass distribution as a function of mass-weighted temperature in filaments with low (orange dashed line), medium (blue dotted line), and high (green dash-dotted line) luminosity overdensity. For comparison, mass within all Bisous filaments is shown with a black line. Bottom: same as top panel, but for the gas mass distribution as a function of gas density contrast. Gas within R200 has been excluded in all panels.
Current usage metrics show cumulative count of Article Views (full-text article views including HTML views, PDF and ePub downloads, according to the available data) and Abstracts Views on Vision4Press platform.
Data correspond to usage on the plateform after 2015. The current usage metrics is available 48-96 hours after online publication and is updated daily on week days.
Initial download of the metrics may take a while.