Fig. 1.
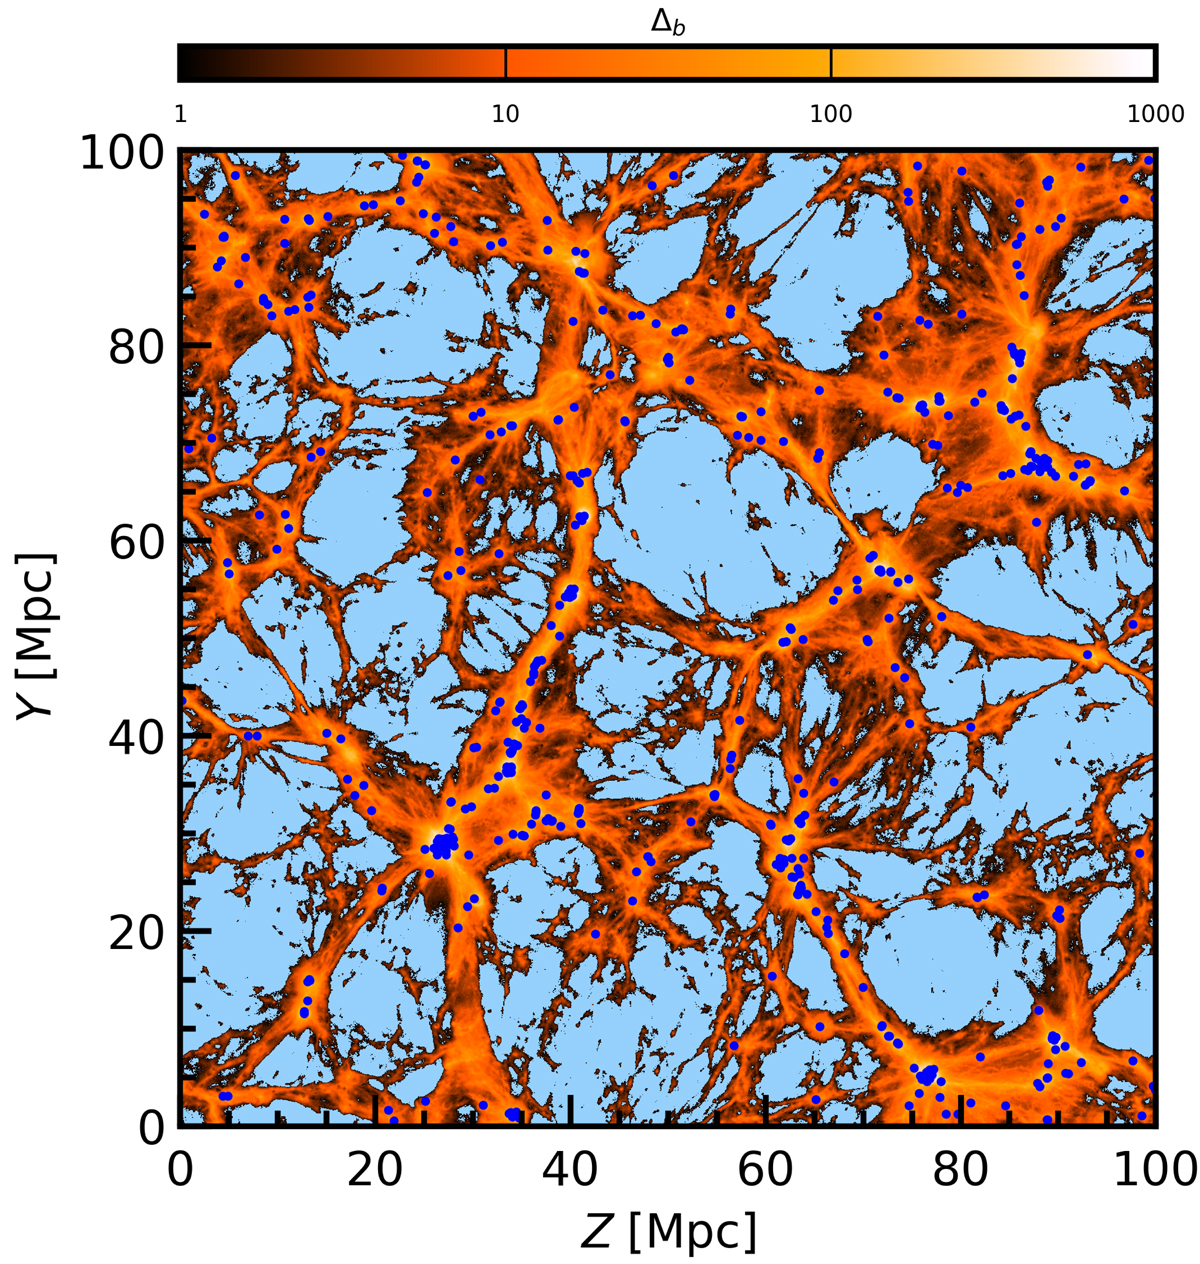
Projected diffuse baryon density within a representative 5 Mpc slice (colour map) above the mean baryon density and galaxies brighter than Mr = −18.4 (blue dots) in the EAGLE simulation. The light blue colour denotes the regions below the mean baryon density. The density was computed by co-adding the masses of individual gas particles and dividing by the projected volume in each pixel.
Current usage metrics show cumulative count of Article Views (full-text article views including HTML views, PDF and ePub downloads, according to the available data) and Abstracts Views on Vision4Press platform.
Data correspond to usage on the plateform after 2015. The current usage metrics is available 48-96 hours after online publication and is updated daily on week days.
Initial download of the metrics may take a while.