Fig. 8.
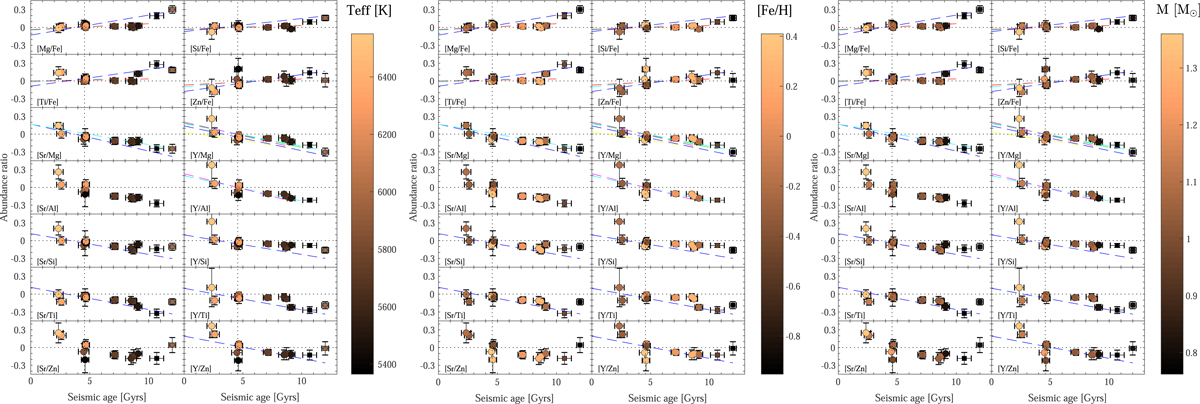
Left panels: variation of abundance indicators, as a function of seismic age. The data are colour-coded as a function of Teff. The thin- and thick-disc stars are shown as circles and squares, respectively. The solar age is shown as a vertical dotted line. Middle and right panels: same as left panels, but colour-coded as a function of [Fe/H] and M, respectively. Linear 1D relations in the literature linking abundance ratios and ages are overplotted as dashed lines: Bedell et al. (2018, red), DM19 (blue), Nissen (2016) and Nissen et al. (2020, cyan), Spina et al. (2018, magenta), Titarenko et al. (2019, yellow), and Tucci Maia et al. (2016, green).
Current usage metrics show cumulative count of Article Views (full-text article views including HTML views, PDF and ePub downloads, according to the available data) and Abstracts Views on Vision4Press platform.
Data correspond to usage on the plateform after 2015. The current usage metrics is available 48-96 hours after online publication and is updated daily on week days.
Initial download of the metrics may take a while.