Fig. 6.
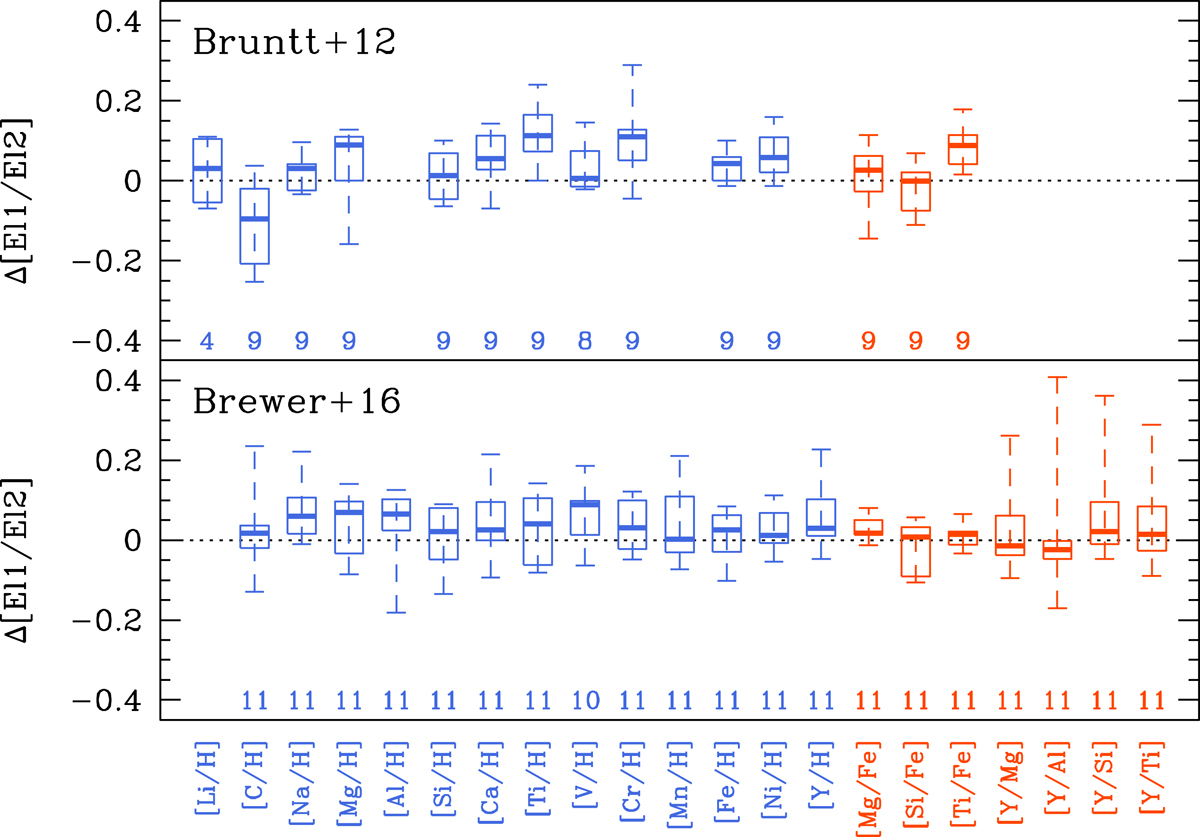
Comparison between our abundance ratios and those of Bruntt et al. (2012) and Brewer et al. (2016). The abundance differences are those of this study minus those of the literature. The vertical dashed line connects the extreme values. The box covers the first to third quartile of the data, while the thick horizontal line inside the box shows the median. As recommended by Bruntt et al. (2012), we chose their Fe II-based abundances for [Fe/H] (but used the Mg I, Si I, Ti I, and Cr I abundances). For KIC 5184732, KIC 7970740, and KIC 8006161, we chose the values of Brewer et al. (2016) corresponding to the spectrum with the highest S/N. The number of stars the calculation is based on is indicated for each abundance ratio. The red symbols show the abundance ratios used as age indicators (Sect. 9).
Current usage metrics show cumulative count of Article Views (full-text article views including HTML views, PDF and ePub downloads, according to the available data) and Abstracts Views on Vision4Press platform.
Data correspond to usage on the plateform after 2015. The current usage metrics is available 48-96 hours after online publication and is updated daily on week days.
Initial download of the metrics may take a while.