Free Access
Fig. 2.
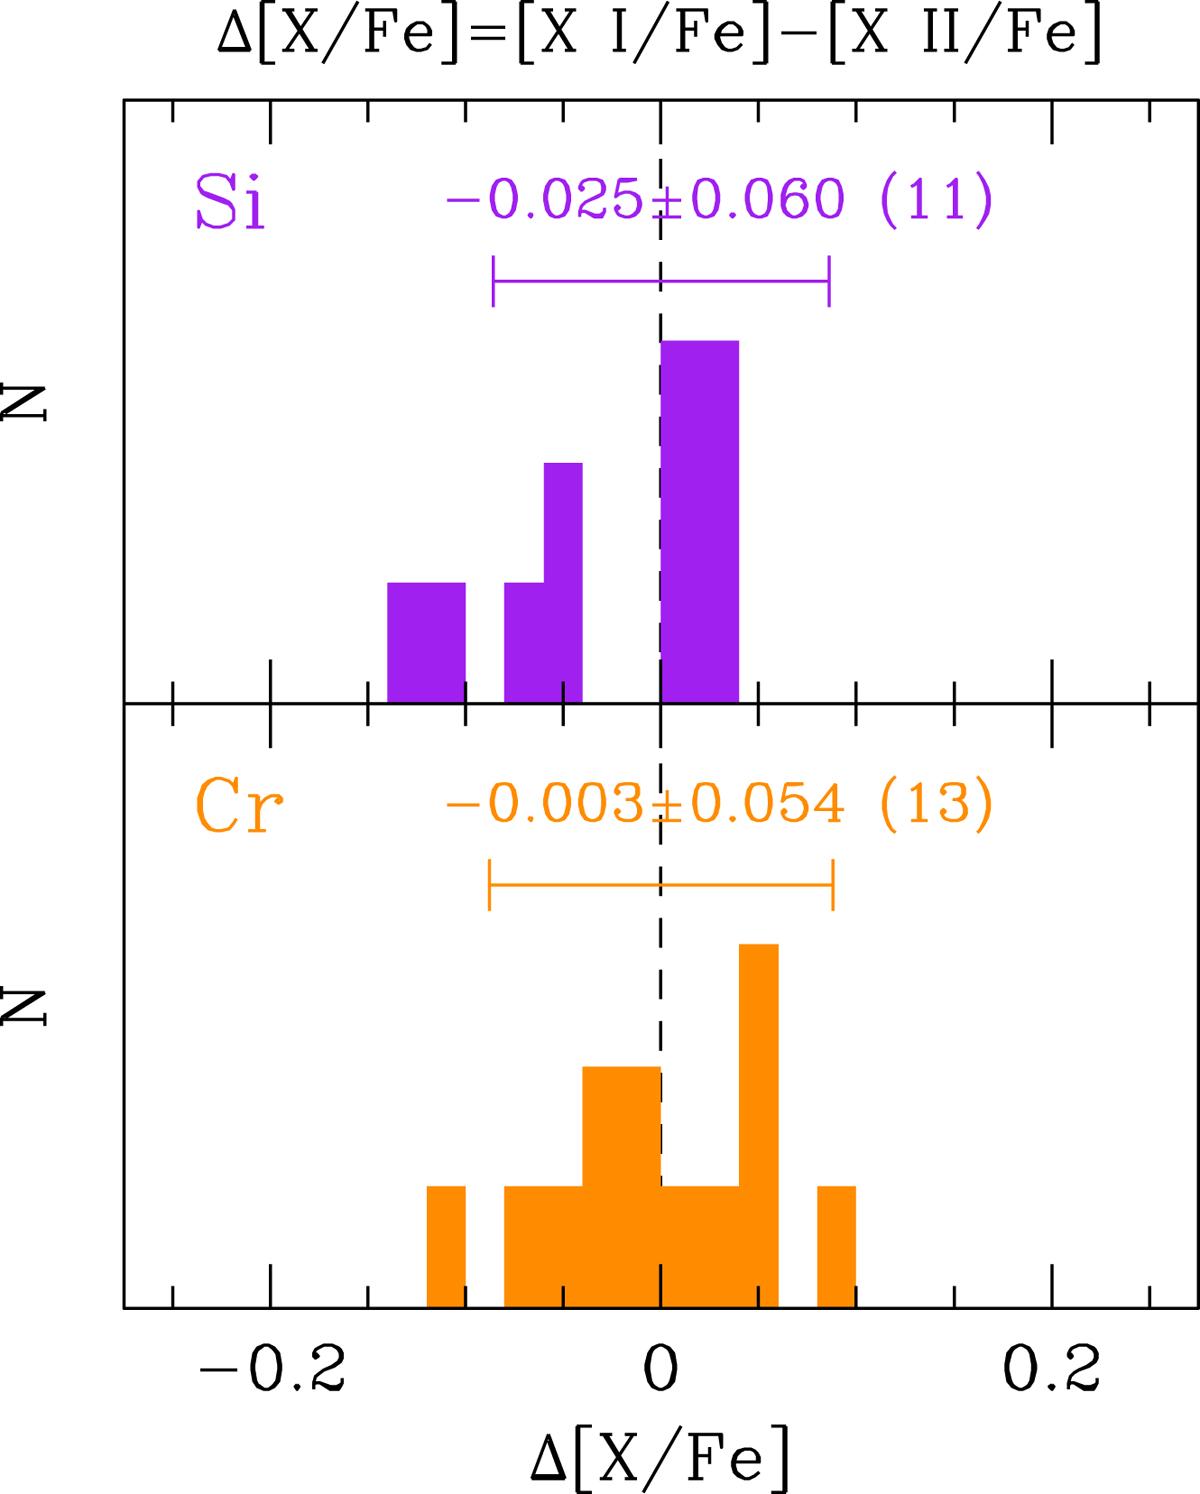
Comparison for Si (top panel) and Cr (bottom panel) between the mean abundances yielded by the neutral and singly-ionised ion. The mean difference is given in each panel (the number in brackets is the number of stars the calculation is based on). A representative error bar is also shown.
Current usage metrics show cumulative count of Article Views (full-text article views including HTML views, PDF and ePub downloads, according to the available data) and Abstracts Views on Vision4Press platform.
Data correspond to usage on the plateform after 2015. The current usage metrics is available 48-96 hours after online publication and is updated daily on week days.
Initial download of the metrics may take a while.