Fig. C.1.
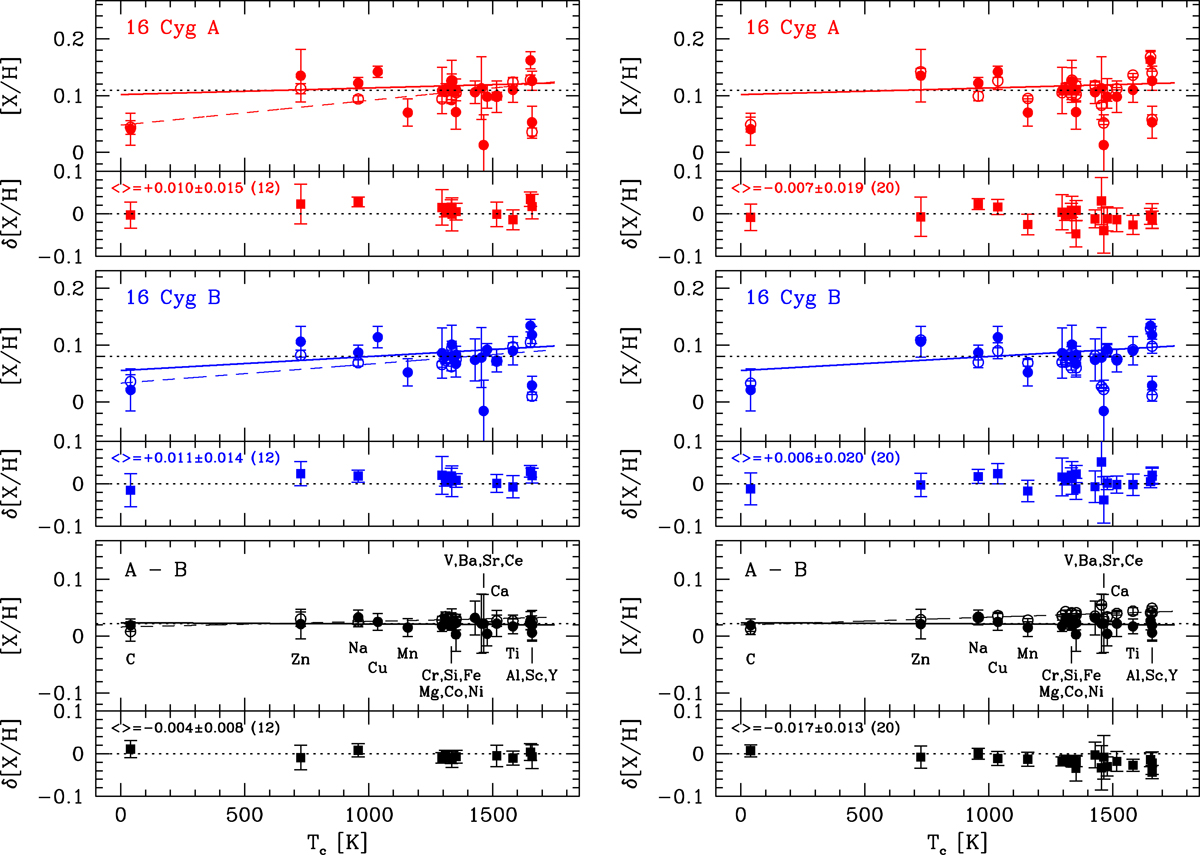
Abundance patterns with respect to hydrogen, [X/H], and differences with respect to literature values (this study minus literature), δ[X/H], as a function of Tc. The left and right panels show the comparison with N17 and Tucci Maia et al. (2019), respectively. We ignored the molecular-based C abundances of Tucci Maia et al. (2019). The results for 16 Cyg A, 16 Cyg B, and 16 Cyg A with respect to 16 Cyg B are shown in the top, middle, and bottom panels, respectively. Our [X/H] results and those in the literature are shown as filled and open circles, respectively. A dotted, horizontal line is drawn at our [Fe/H] value. The solid lines show the weighted, linear fit of [X/H] as a function of Tc. The fits obtained in the literature for the full set of elements are overplotted as dashed lines (the trends for 16 Cyg AB with respect to the Sun are not available in Tucci Maia et al. 2019). The average δ[X/H] values are given in the relevant panels (the number of elements in common is indicated in brackets). To guide the eye, a dotted line is drawn at δ[X/H] = 0.
Current usage metrics show cumulative count of Article Views (full-text article views including HTML views, PDF and ePub downloads, according to the available data) and Abstracts Views on Vision4Press platform.
Data correspond to usage on the plateform after 2015. The current usage metrics is available 48-96 hours after online publication and is updated daily on week days.
Initial download of the metrics may take a while.