Fig. 13.
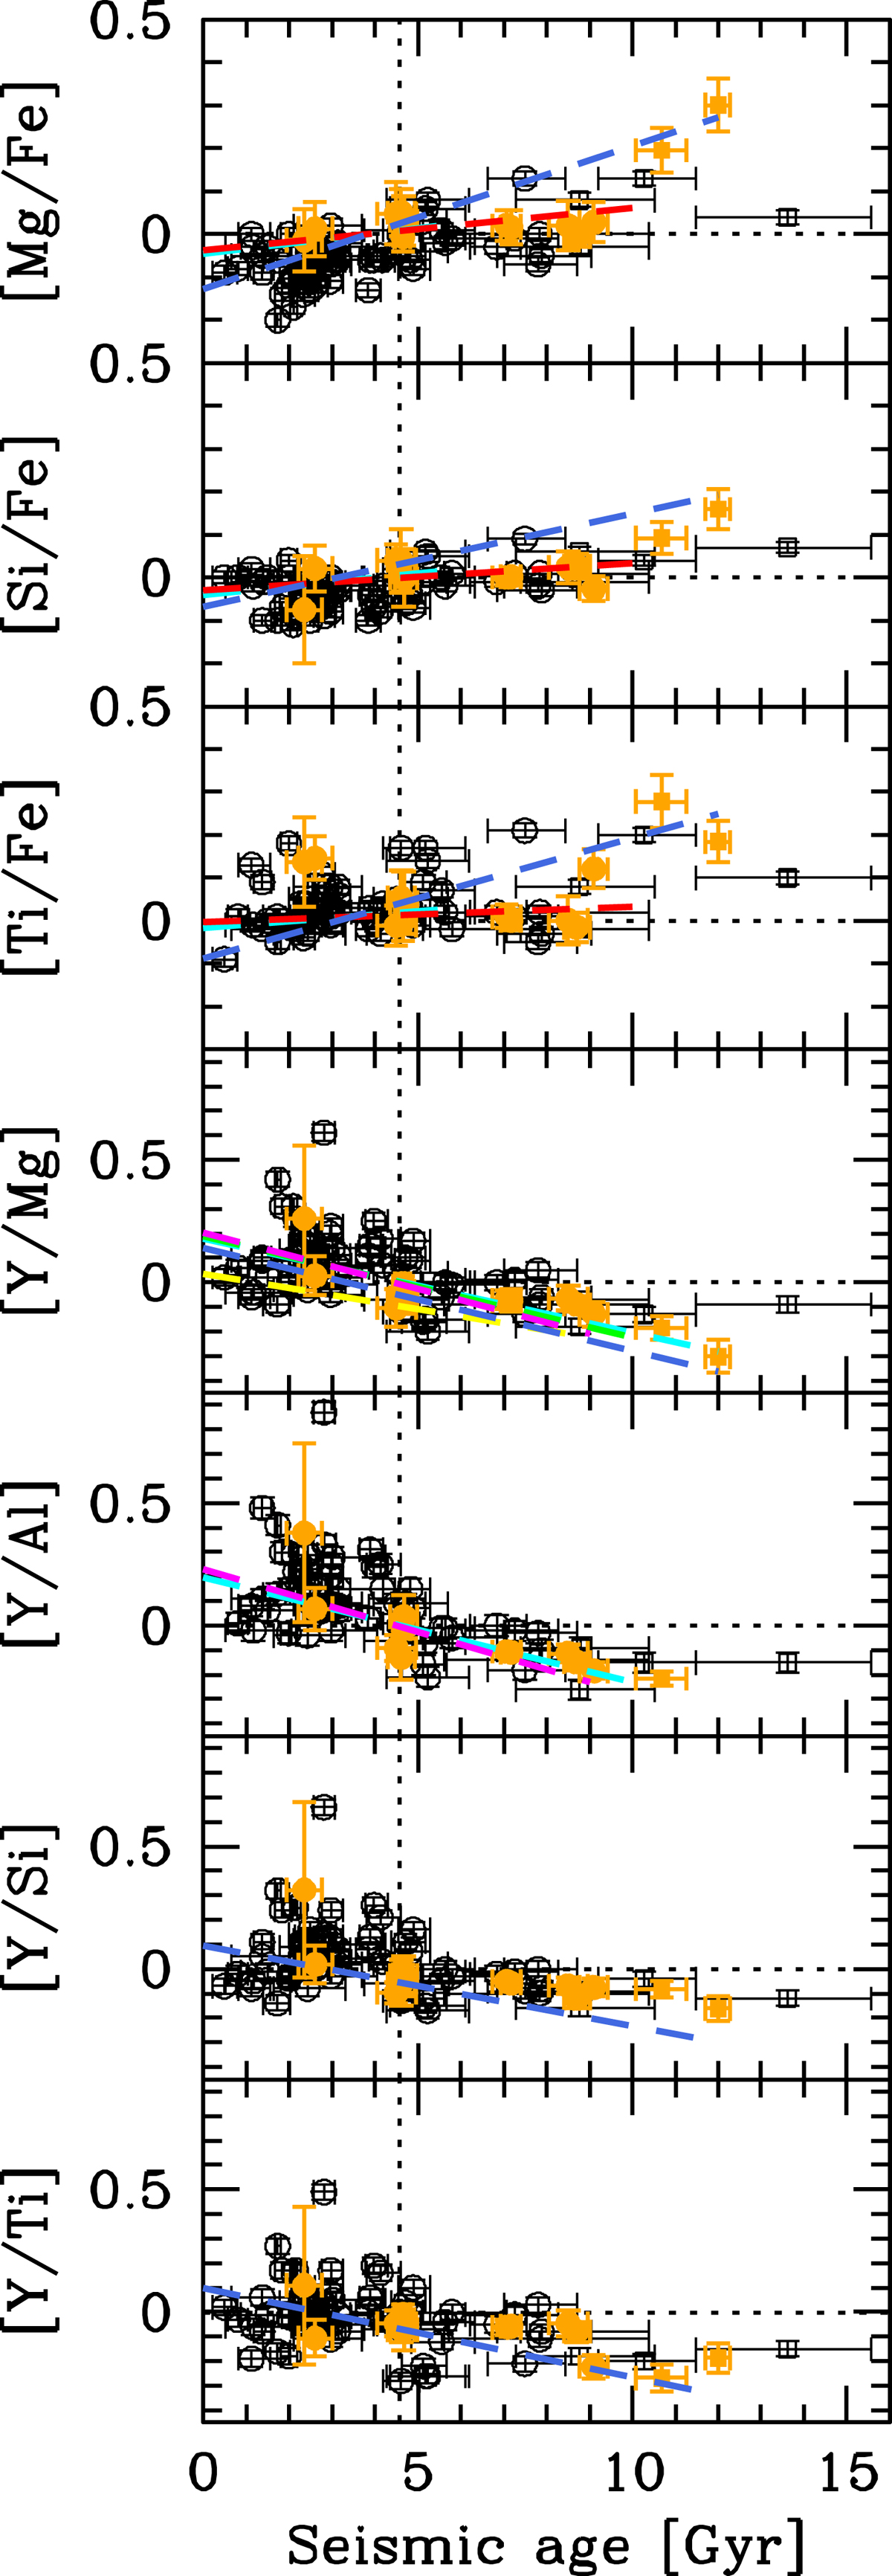
Abundance-age trends for our data (filled symbols) and those of Brewer et al. (2016, open symbols). The ages were derived by different means: detailed modelling of the oscillation frequencies and from global seismic quantities, respectively. The very high [Y/Al] abundance ratio (∼+1.35) obtained by Brewer et al. (2016) for KIC 3733735 is off scale. The thin- and thick-disc stars are shown as circles and squares, respectively. Linear 1D relations in the literature are overplotted as dashed lines: Bedell et al. (2018, red), DM19 (blue), Nissen (2016) and Nissen et al. (2020, cyan), Spina et al. (2018, magenta), Titarenko et al. (2019, yellow), and Tucci Maia et al. (2016, green). The solar age is shown as a vertical dotted line.
Current usage metrics show cumulative count of Article Views (full-text article views including HTML views, PDF and ePub downloads, according to the available data) and Abstracts Views on Vision4Press platform.
Data correspond to usage on the plateform after 2015. The current usage metrics is available 48-96 hours after online publication and is updated daily on week days.
Initial download of the metrics may take a while.