Fig. 6.
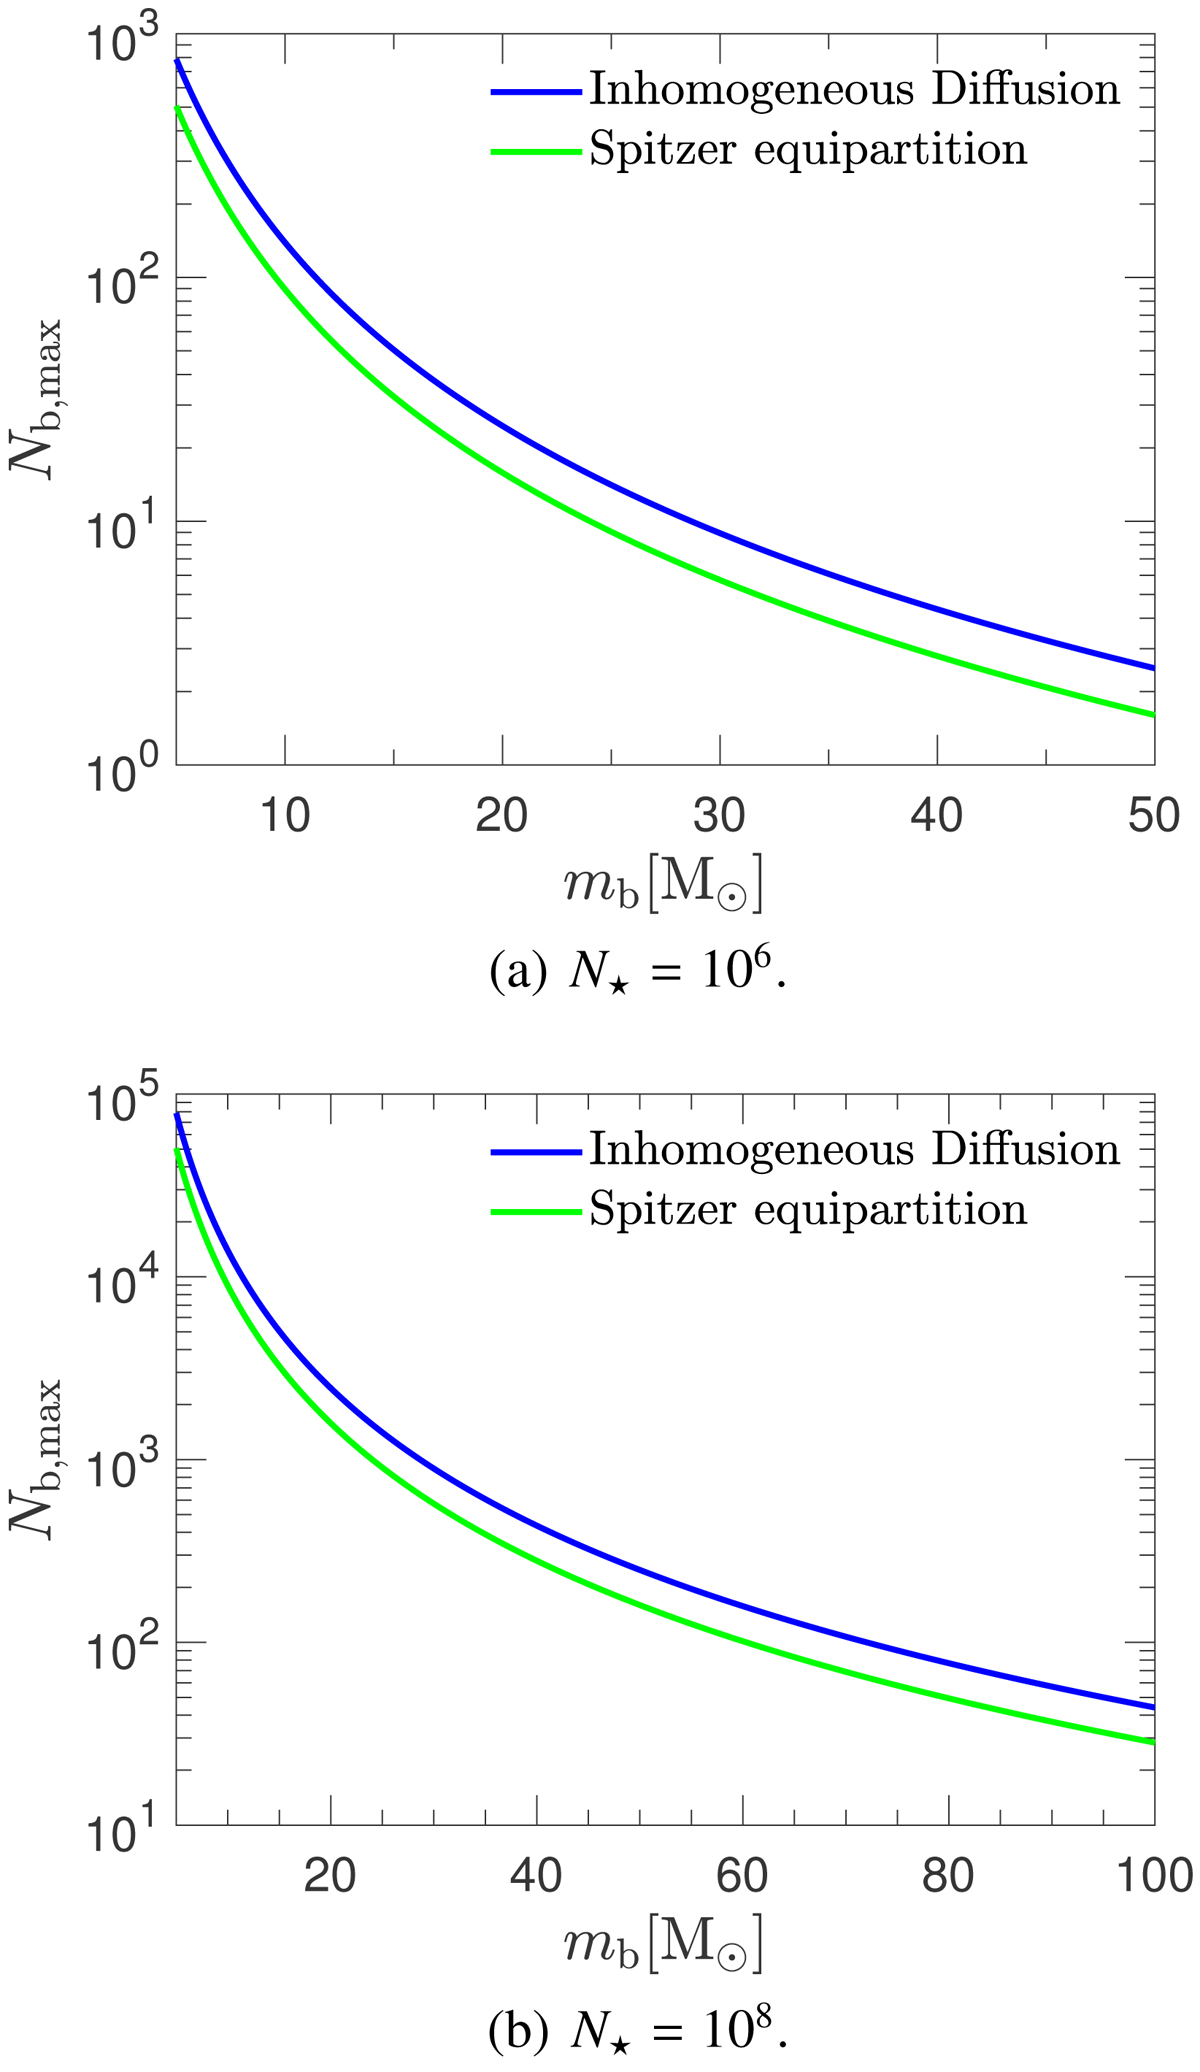
Maximum number of BHs with respect to their individual mass that may maintained at a stationary state inside a Plummer stellar profile with m⋆ = 0.5 M⊙ and two cases of a number of stars of N⋆ = 106, 108. Upper blue curve corresponds to our model for inhomogeneous diffusion, while the lower green one to the Spitzer instability limit derived from the energy equipartition.
Current usage metrics show cumulative count of Article Views (full-text article views including HTML views, PDF and ePub downloads, according to the available data) and Abstracts Views on Vision4Press platform.
Data correspond to usage on the plateform after 2015. The current usage metrics is available 48-96 hours after online publication and is updated daily on week days.
Initial download of the metrics may take a while.