| Issue |
A&A
Volume 646, February 2021
|
|
|---|---|---|
| Article Number | A163 | |
| Number of page(s) | 7 | |
| Section | Interstellar and circumstellar matter | |
| DOI | https://doi.org/10.1051/0004-6361/202039105 | |
| Published online | 23 February 2021 | |
Revisiting the OH + H2 → H2O + H reaction at the molecular level: the plausible catalytic role of ice in its own reconstruction
1
Sorbonne Universités, UPMC Univ. Paris 06, UMR, CNRS 7616, Laboratoire de Chimie Théorique,
75252
Paris Cedex 05, France
e-mail: This email address is being protected from spambots. You need JavaScript enabled to view it.
2
Universidad de Valladolid, Facultad de Ciencias (Dpto. QF),
Valladolid, Spain
e-mail: This email address is being protected from spambots. You need JavaScript enabled to view it.
Received:
4
August
2020
Accepted:
26
December
2020
Abstract
Context. In spite of the permanent damage suffered from the radiation field (cosmic rays, X-rays, and intense UV-visible radiations), interstellar grains are still covered by ices mantles whose role in interstellar chemistry is well beyond any doubt. This clearly means that the destruction of the ice cover has to be counterbalanced by efficient reconstruction mechanisms.
Aims. Our goal is to determine whether the ice, which is still present after irradiation, has a catalytic role in the OH + H2 → H2O + H reaction for its own reconstruction. We focus on the three plausible reaction paths depending on the way reactants OH or H2 are adsorbed at the ice surface.
Methods. Calculations were performed in both cluster and solid state approaches, using ab-initio post Hartree-Fock methods for small systems, standard density functional theory (DFT) for larger clusters, and periodic solid state DFT with specific formalisms accounting for weak interactions in systems of infinite dimensions.
Results. Although the end product is the same, that is namely the reconstruction of one H2O on the subjacent ice, three different reaction paths are found depending on whether H2 reacts with adsorbed OH(ads), wether OH reacts with adsorbed H2(ads) or wether both OH(ads) and H2(ads) are adsorbed on the ice before reacting. In the first case, there is an activation barrier of ~6 kcal mol−1, requiring the tunneling effect for the reaction to proceed, which is in agreement with preceding studies. In the second case, the reaction is a barrierless process leading to the direct reconstruction of the ice. In the third case, the double adsorption increases the activation barrier due to the lowering of the starting energy. This is found regardless of the dimension of the supporting ice aggregates.
Conclusions. Icy grain surfaces play a critical role for their own reconstruction in cold, dense interstellar clouds. The prevalence of tunneling over the direct mechanism should strongly depend on the temperature and local environment.
Key words: astrochemistry / ISM: molecules / ISM: abundances / molecular processes / solid state: volatile
© P. Redondo et al. 2021
 Open Access article, published by EDP Sciences, under the terms of the Creative Commons Attribution License (https://creativecommons.org/licenses/by/4.0), which permits unrestricted use, distribution, and reproduction in any medium, provided the original work is properly cited.
1 Introduction
The hypothesis of the existence of water ice in the interstellar medium (ISM) goes back to the beginning of the last century when Eddington (1926) proposed that the water molecules would aggregate to form small grains in the dark clouds between stars. Then, infrared observations have shown that ice is a robust material that can be found almost everywhere in the cold ISM (Merrill et al. 1976; Whittet, et al. 1988; Dartois et al. 1998; Gibb et al. 2004; Boogert et al. 2008; Oberg et al. 2011). Moreover, a general consensus has developed that processes on icy grains had to play a major role in astrochemistry. A thorough presentation of the history of water formation can be found in Oba et al. (2012). The key reference is that of Tielens & Hagen (1982) followed by numerous studies (d’Hendecourt et al. 1985; Hasegawa & Herbst 1993; Cuppen & Herbst 2007), a non-exhaustive list that can be extended to the present days with Meisner et al. (2017) and Lamberts, & Kästner (2017).
Considering the extremely dilute environment of the ISM, it is agreed that a simple freeze out of the water present in the gas phase cannot be the only origin of the icy grain mantles in which H2O is the dominant component. The problem becomes even more sensitive if one considers that the ice mantles are currently subject to intense damages from the radiation field (irradiation by cosmic rays, energetic X-rays, UV-visible radiations, etc.), resulting in continuous destruction of the ices, which have to be reconstructed one way or another by surface reactions. Two irrefutable pieces of evidence have to be taken into account. On the one hand, the rupture of the H2O molecules gives three elementary fragments, that is H, O, and OH, all of these free radicals are known to be particularly reactive. On the other hand, the grain surface is widely covered by H2 which is the dominant species in the environment.
Lookingat the available reactants, the most plausible reactions, that is to say those that effectively yield H2O, are as follows:
 (1)
(1)
 (2)
(2)
to which, according to Cuppen & Herbst (2007), a third reaction should be added,
 (3)
(3)
From their kinetic model Cuppen & Herbst evaluated the efficiency of the above three reactions to be 6, 77 and 17% at 10 k in dense clouds for (1), (2) and (3), respectively. Formation of H2O following
 (4)
(4)
has also been recently considered as plausible when supported by ice layers (Redondo et al. 2020). This reaction appeared to be a barrierless mechanism that could be more important than thought originally. It has to be noted that the formation of OH could formally appear in
 (5)
(5)
but this process should be most likely marginal, due to the volatility of the hydrogen atom. Diffusion of H atoms might also be an other reason of the presence of the molecular H2 that is used by reaction (2). More is presented in the chemical network proposed by Tielens & Hagen (1982) for H2O synthesis. For example, hydrogenation of atomic oxygen, molecular oxygen (Ioppolo et al. 2010; Cuppen et al. 2010) and ozone (Mokrane et al. 2009) are not only at the origin of several chemical models but also inspired most of the laboratory astrophysics studies.
The important facts are that the OH radical appears at one stage or another in all mechanisms of H2O formation and that H2 is omnipresent in the icy grains environment. These are two main reasons why we focused on reaction (2). Even if the end products are the same, i.e. formation of a water molecule on the icy surface and release of a H atom, three reaction mechanisms are to be considered at the molecular level. The differences rely on the distinct structures of their respective adsorption elementary steps
![Mathematical equation: \begin{align*} &\textrm{H}_2 + \textrm{OH}_{\textrm{ads}} \rightarrow {\textrm{H}}_2\textrm{O}_{\textrm{ads}} + \textrm{H}\nonumber\\ &\textrm{OH} + \textrm{H}_{\textrm{2~ ads}} \rightarrow {\textrm{H}}_2\textrm{O}_{\textrm{ads}} + \textrm{H}\nonumber\\ &[\textrm{OH} + \textrm{H}_2]_{\textrm{ads}} \rightarrow {\textrm{H}}_2\textrm{O}_{\textrm{ads}} + \textrm{H}.\nonumber \end{align*}](/articles/aa/full_html/2021/02/aa39105-20/aa39105-20-eq6.png)
On the one hand, the well-admitted reaction of H2 with an adsorbed OHads radical, on another hand the reaction of OH with an adsorbed H2 ads and finally the reaction starting with the reagents [OH + H2 ]ads both adsorbed on the surface or in a void inside the ice.
2 Computational methods
Looking for the feasibility of the OH + H2 reaction on a solid water ice support requires procedures capable of giving comparable descriptions of the reactive potential energy profile whatever the extension of the substrate support (aggregate of finite or solid of infinite dimensions). If ab-initio methods can be used for clusters with small numbers of H2O molecules, DFT methods are the natural choice for large structures and solids.
2.1 Cluster approach
In cluster calculations, the correlation and dispersion effects were taken into account in post Hartree-Fock MP2 and coupled cluster calculations using single, double and triple excitations within the CCSD and CCSD(T) formalism (Bartlett & Shavitt 1977; Raghachavari et al. 1989). Then, anticipating calculations on much larger systems, we considered also the BHandHLYP (Becke 1993) and the MPW1K and MPWB1K functionals (Lynch 2000; Zao & Truhlar 2004). Concerning basis sets, we have essentially employed the cc-pVTZ basis sets, augmented with diffuse functions. For the largest calculations we used the 6-311++G(3df,2p).
Each structure, fully optimized, was verified to be a stationary point by vibrational analysis. We checked also that including entropic terms to determine Gibbs free energies of formation at the temperature of the interstellar grains considered here has a marginal impact on the values of the energy differences. All the calculations were performed using methods and basis sets as implemented in the GAUSSIAN09 package (Frisch et al. 2013).
Relative energies (kcal mol−1) of critical points along the reaction profile for H ) + OH(2 Π) → H2O(1A1) + H(2 S), including zero point vibrational energies.
2.2 Solid state approach
As in previous works on interactions of organic molecules with water ices (Lattelais et al. 2011, 2015; Redondo et al. 2020) we used the plane waves Vienna ab initio simulation package (VASP; Kresse & Hafner 1993, 1994) to carry out all the solid state calculations. The treatment makes use of the same (PBE+D2) functionals corrected following Grimme et al. (2010) to account for the long range interactions specific of that type of studies and to which 50% of exact Hartree-Fock exchange was added to make comparison possible with MPW1K and MPWB1K functionals. Details on the ice modeling are presented in Appendix A.
3 The H2 + OH gas phase reaction as a case study
Using the gas phase reaction as a test, we compare the CCSD(T) values with those of DFT calculations with the same basis sets. Energies for critical points are presented in Table 1.
At the CCSD(T)/aug-T level, which we consider as level of reference, it is an exothermic process with a value of ΔH ~13–14 kcal mol−1. It is opposedby an energy barrier ΔH# ~6 kcal mol−1 in agreement with the literature (Chen et al. 2013). As in our previous study of the OH + OH reaction (Redondo et al. 2020) we found that the stationary points are the same for all levels of theory and that the whole reaction proceeds in the same plane for all methods.
Compared to CCSD(T)/aug-T, the exothermicity and activation barrier are largely overestimated at the MP2 level. It shows that higher excitations are clearly needed to get reasonable values as already found for OH + OH. However, using the MP2 optimized geometries in the CCSD(T)/aug-T//MP2/aug-T calculations is a less expansive alternative since it provides energy differences similar to those obtained in fully optimized CCSD(T)/aug-T treatments. Concerning DFT methods, the newly developed MPW1K/MPWB1K functionals provide energies lower in the average by ~ 0.7 kcal mol−1 for exothermicity and activation barriers than optimized CCSD(T), these values being most reasonable for methods a priori not calibrated for small radicals reactions.
The first conclusion to be drawn from this case study approach is that a reasonable geometry can be obtained at the MP2 level that can be employed for the calculation of the energy profile at higher level of theory (CCSD(T)),
The second conclusion concerns the larger calculations for which the DFT approach can be limited to MPW1K (ΔH#)/MPWB1K (ΔH) functionals in cluster type calculations. This test model, that is only relevant to gas phase, is clearly impeded by an activation barrier of ~6 kcal mol−1. A similar result has been found by Meisner et al. (2017) using QM/MM semi-empirical simulations, that is a reaction barrier of 5.74 kcal mol−1.
At this point, it should be emphasized that CCSD(T) is only considered to validate the use of MPW1K/MPWB1K functionals to follow the adsorption process from the simplest aggregates to larger molecular clusters formed by increasing the number n of H2O molecules up to the 48 H2O in structures composed of two bi-layers. These calculations employ the current type of Gaussian atom-localized basis sets. They are not intended to select the functional to be used for a solid state of infinite dimensions. In this latter case, the determination of the binding energies makes use of DFT (PBE+D2) periodic calculations using plane-wave basis sets, thus insuring by construction the continuity of the electronic density in the entire solid, a continuity that cannot be obtained, even for CCSD(T), with atomic basis sets of tractable dimensions. In fact, we have used two different approaches adapted to two different molecular scales. More details on the aptitude of the periodic “first principle” approach to the calculation of gas-molecular solid interactions can be found in Doronin et al. (2015) and Bertin et al. (2017).
 |
Fig. 1 Adsorption of OH (left) and H2 (right) on ice; the same arrangements are found (not shown) for large clusters 24(1-L.) and 48(2-L.). |
4 Interstellar context: OH versus H2 adsorption
The ice that is destroyed is essentially that which covers the interstellar grains. As long as the temperature is not high enough to vaporize the mantle completely, there is a possibility for the ice to play the role of a full partner in reaction (2). But one has to realize that the possibility for the ice to intervene as catalytic support in such a reaction raises a question that does not exist in gas, namely, which of the partners is present on the ice (OH or H2 or both). How differently the reaction might proceed is critically dependent of their respective binding energies to the ice support and abundances.
The most stable geometries are presented in Fig. 1 for the case of solid water ice. The binding energies along the series of the aggregates considered for the simulations are given in Table 2.
The OH radical is positioned as a bridge on the surface (Fig. 1-left), with two hydrogen bonds. One of these bonds implies the hydrogen atom and an electronic lone pair of a surface oxygen, the other a lone pair of the oxygen and an hydrogen of a dangling OH bond of the surface. This double link leads to an interaction energy E(OH)ads = 16.1 kcal mol−1 with the solid surface much stronger than that with a single H2O or even with the larger clusters (5.6 to ~12 kcal mol−1) as shown in Table 2.
The H2 molecule has only one hydrogen bond (Fig. 1-right), this being collinear with an electronic lone pair of a surface oxygen. The minimum distance between two adjacent H2 ads molecules on the surface is ~4.4 Å, which is larger than the equilibrium distance in the H2 dimer. Thus, contrary to the adsorption of H2 on graphene(Pauzat et al. 2011) there is no lateral interactions (attractive) to stabilize the coverage of ice by molecular hydrogen1.
From these results (Table 2) it can be stated that:
- (i)
When increasing the dimensions of the supporting cluster layer models, both E(H2)ads and E(OH)ads tend towardlimits consistent with those obtained in the solid representation.
- (ii)
The binding energies E(H2)ads on the small clusters (n = 1−3) are rather small for the eventual variations be hidden within the computational accuracy; only the larger clusters reveal the global binding energy increase as in the OH case.
- (iii)
For the binding energy, E(OH)ads, the first leapfrom 5.6 to 9.7 kcal mol−1 when going from a one to a two-molecule support shows the change from one to two hydrogen bonds; the following increases, smaller, illustrate a cooperative effect which culminates with the solid representation.
- (iv)
The E(OH)ads binding energy is about one order of magnitude larger than E(H2)adswhatever the dimension of the solid support.
- (v)
On the other side, E(H2)ads can effectively stay attached on the water-ice surface only in cold environments in which the mantle of the grains is surrounded mostly by molecular hydrogen.
- (vi)
Considering the binding energies in Table 2 it is more than plausible that both OHads and H2 ads can coexist on the ice surface, which in the end opens the way to a third mechanism. In the end we face three possibilities for the reconstruction of the ice, namely, reaction of H2 on OHads, actually considered the dominant process, attack of the OH radical on H2 ads and reaction between OHads and H2 ads, both partners being already adsorbed or remaining trapped inside the irradiated ice. The first two belong to the Eley-Rideal type, (hereafter referred to as ER(OHads) and ER(H2 ads,) respectively), whereas the third is a typical Langmuir- Hinschelwood, LH(OH+H2)ads mechanism.
Electronic binding energies(*) (kcal mol−1) of H2 ads and OHads as a function of the number (n) of H2O in the supporting cluster.
Relative energies (kcal mol−1) for the reaction profile for H ) + OHads(2Π) → H2O(1A1) + H(2 S) as a function of the number of H2O molecules in the supporting cluster.
5 Adding H2 in the OH adsorbed model
Knowing the difference in binding energies (one order of magnitude) between H2 and OH on an icy surface, we started with the case when the hydroxyl radical OHads is already attached on the ice. Looking for consistency between the cluster and the solid state representations, we considered the possible role of neighboring molecules. To this end, we progressively increased the number n of water molecules in the reaction support. Reporting the gas phase results (n = 0) for comparison, we present in Table 3 the evolution of the transition state energies ΔH# from n = 1−3 to bi-layers of H2O molecules and in fine to a slab of ice of infinite dimension.
5.1 The H2 + OHads reaction atop small clusters
In the presence of OHads adsorbed on one, two, then three H2O molecules, we obtain energy profiles very similar to that of the gas phase reaction. It is illustrated in Fig. 2 on the example of the reaction occurring on a water dimer support taking the MPWB1K energy reported in Table 3. The reaction with H2 proceeds through transition states ~5 kcal mol−1 above the starting complexes. The final products in these model reactions consist in a [(H2O)n+1] structure showing the growth of the water support together with an hydrogen atom desorbing to the gas phase. Whatever the size of the small cluster the ice reconstruction are exothermic by ~15–16 kcal mol−1 (Table 3). Up to this point, there is no clear-cut correlation to the number of H2O taken to model the ice support.
5.2 The H2 + OHads reaction atop ice layers
It is well known that increasing the dimension of the cluster (that is to say increasing n) leads, after full geometry optimizations, to very different stable structures that do not properly mimic the solid water ice, as demonstrated by the numerical simulations (Buch et al. 2004) of the structures of (H2O)n aggregates. Consequently, in order to go one step further in the modeling of the ice environment, we set up an H2O layer model. As in the previous study of OH + OH reaction (Redondo et al. 2020) we take the topmost bi-layer of an apolar hexagonal ice Ih that has been shown to be the most stable surface (Pan et al. 2010) and only the reaction site was optimized in order to avoid the aforementioned artifacts.
For these larger models we used the MPWB1K/MPW1K functionals. However, the dimension of the system H2 + OH + [H2O]bi-layers makes the geometry optimizations with the aug-cc-pVTZ basis set barely tractable. Therefore, we have characterized the critical points on the surface employing a smaller double zeta basis set augmented, as previously, by diffuse functions (3-21+G**). The energies were then refined by single points calculations using the larger aug-cc-pVTZ and 6-311++G(3df,2p) basis sets2. The reaction profile of H2 + OH supported by the water ice layer is presented in Fig. 3. Starting from OHads adsorbed on the ice surface, the reaction proceeds towards an H2O molecule attached to the surface with an hydrogen desorbing. Snapshots of the reaction site along the reaction path are presented for more details. The important point is that the energy barrier is still present on the reaction path and remains close to ~5 kcal mol−1) even in a 2 bi-layer cluster model (Table 3).
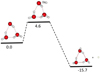 |
Fig. 2 Reaction profile for H |

5.3 The H2 + OHads reaction atop solid water ice
The next step is to represent the environment of the reaction path by a solid icy surface of infinite dimension. The same reaction scheme as above is investigated, starting with the hydroxyl radical OHads first adsorbed on the surface. Several stable positions of attachment are possible (Meisner et al. 2017). We opted for the energetically most stable, i.e. bridge conformation.
The structure of the transition state is that represented on Fig. 4-left. The H–H distance of ~0.82 Å is larger than in the gas phase (0.74 Å). At the same time, the OH distance between the hydroxyl oxygen in OH and the nearest hydrogen of H2 is ~1.33 Å. It is more than the equilibrium distance in H2O (1.00 Å) but indicates the driving force towards the formation of the water molecule added to the subjacent ice represented on Fig. 4-right.
The critical parameters of the reaction mechanism ΔH# and ΔH are given in the last two columns of Table 3. The energetics of the reaction shows that, when OH is already adsorbed, the process is exothermic by approximately −16 kcal mol−1 and presents a significant activation barrier of ~4 kcal mol−1, this requiring a tunnel effect to reach the final products. Comparing these numbers with the preceding ones of the different clusters models leads to the conclusion that, in that case of OH adsorbed model, neither the activation barrier nor the exothermicity of the formation of H2O are significantly modified by the presence of the ice.
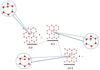 |
Fig. 3 Reaction profile for H |

 |
Fig. 4 Structures of the transition state (left) and final product of the OH first process for H2 + OHads → H2Oads + H on top of solid water ice. |
6 AddingOH in the H2 adsorbed model
In cold environments where icy grains are immersed in abundant molecular hydrogen, attack of the OH radical on H2 ads adsorbed has also been considered. The same set of calculations as above has been carried out on the small clusters, the ice bilayers and the solid ice n(H2O) = 1, 2, 3, 24, 48 and ∞(Solid).
How thetransition state energy ΔH# is sensitive to the molecule first adsorbed is shown in the first two lines of Table 4 where the results of the two mechanisms are reported for comparison.
The striking result of the H2 adsorbed model is that the process is really sensitive to the addition of H2O molecules and that there is no activation barrier as soon as H2O plays the role of support in the reaction. We find a hidden barrier whose depth below the reference energy increases with the number of supporting molecules toa limit of ~10 kcal mol−1 for the solid model. This means that no barrier should oppose to the formation of H2O in that case.
The reaction of OH with an H2 adsorbed on the ice surface is usually not considered because E(H2)ads is supposedly too small for H2 to play a significant role. However, when looking carefully at this mechanism (see Table 4) it is obvious that this process can be efficient and is intrinsically different from that in which OH, adsorbed on the surface is the target of the H2 attack. In short, the reaction is exothermic by approximately −29 kcal mol−1 and there is no transition state on the way to the H2O formation.
Transition state energies(*) ΔH# (kcal mol−1) with respect to the energies of the reactants (OH)ads, (H2)ads, and (OH+H2)ads as a function of the number (n) of H2O in the supporting cluster.
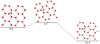 |
Fig. 5 Reaction profile for H2 ads(1Σ+) + OHads(2Π) → H2Oads(1A1) + H(2 S) at the MPWB1K/aug-cc-pVTZ level in presence of a 1-layer of H2O. Relative energies are given in kcal mol−1. |
7 Reaction between OH and H2 both adsorbed on the ice
The situation of multi adsorptions is largely plausible in the ISM context. Due to the one order of magnitude difference between E(OHads) and E(H2)ads it is reasonable to expect the starting point of this mechanism to be lower than the one with only OHads on the ice.
Simultaneous optimization of both OH and H2 on the supporting ice models, using the same protocol as before, leads to the new values of the transition states energies reported in line 3 of the updated Table 4. The increase in the ΔH# values is systematic and illustrates the weak extra stabilization of the LH(OH+H2)ads starting complex. This difference would have been close to E(H2)ads, if there were no structural relaxation of the system. The energy profile is shown in Fig. 5.
8 Summary and final remarks
The aim of this theoretical work was to shed some light, at the molecular scale, on the feasibility of the

reaction proposed by Tielens & Hagen (1982) as one of the mechanisms at the origin of the formation of interstellar ices. In view of the resilience of the ice confronted to the radiation field we wondered about the influence of the water support on its own reconstruction as well as the influence of the environmental conditions. Indeed this reaction is particularly important in regions of high density where the temperature is low (10–30 K) so that the sticking of H2 on the surfaces of grains becomes critical to astrochemical modeling (Wakelam et al. 2016; Ruaud et al. 2016).
To address the question of the ice reconstruction we used a multistep approach seeking continuity between water aggregates and solid state as the number n of H2O molecules inthe reaction support grows to infinity. It is well-known indeed that a single computational methodology cannot accurately describe the same chemical process at different molecular scales. Small clusters can be treated by the most sophisticated post Hartree-Fock methods but they can only provide accurate results for case studies that cannot describe a real ice support. For more realistic systems of larger dimensions we turned to DFT known to deliver reliable results for such systems. Our last step of calculations considers the solid state situation taking a surface of infinite dimension to close the question of the surface extension.
Considering the binding energies in Table 2 we may expect three different mechanisms at the molecular level, ER(OH) and ER(H2) of Eley-Rideal type and LH(OH+H2) of Langmuir-Hinschelwood type.
The last situation is essentially adapted to large clusters and solid state, then a plausible alternative in the ISM context. Due to the one order of magnitude difference between E(OHads) and E(H2)ads we find the starting point of the LH mechanism to be lower than the one with only OHads on the ice, the consequence of which is an increase in the barrier opposing the reconstruction of the ice. The energy profiles of the three mechanisms are presented together with the Langmuir-Hinshelwood mechanism in which both OH and H2 are adsorbed (Fig. 6) taking the energy of the non interacting system [OH, H2, (H2O)n] as arbitrary reference.
The remarkable result is that, whatever the theoretical model, the activation barrier is still present on the energy profile for the reaction

of H2 on an adsorbed OH with a value of ~4 kcal mol−1. The presence of a water solid support seems to have no influence at all on the process at the molecular level. The result seems consistent with both the early work by Baulch et al. (1984) and the recent study of Meisner et al. (2017) who also argued that only OH adsorption should be considered in view of its large value. Nevertheless, in opposition to the common paradigm, and knowing the high density of H2 in many regions of the ISM, we considered that the coverage of the ice by H2 is also a reasonable assumption taking account the relative abundances of these two species (H2 /OH certainly ≫10). We found a completely different energetic profile of the reaction

when OH reacts with an H2 adsorbed on the ice. Namely, that there is no activation energy to prevent the pursuit of the H2O synthesis. It must be stressed that this result is valid whatever the size of the ice support, cluster of limited size or solid surface of infinite dimensions which should be equally correct for both porous or crystalline ices. The solid state approach, designed to bypass the possible artifacts (if any) coming from the use of models limited in size, provides a robust confirmation of no barrier at all opposing the reaction on the surface.
In short,when H2 reacts with OH adsorbed on the ice, ΔH# is in the range of 4.1 ± 0.6 kcal mol−1 whatever the ice support, small cluster or solid water ice. It is totally different when it is OH that reacts with H2 adsorbed on the ice. The formation ofH2O becomes a no-barrier process as soon as H2O is implied.
The only problem with the “H2 as a target” hypothesis is that of the temperature of the grain ice mantles. For very low temperature, ~10 K, several layers of H2 are deposited on the ice surface. The deepest one is attached to the ice by an energy between ~440 K (value estimated by Cuppen & Herbst (2007) from a number of experiments) and our theoretical value of ~850 K (this work). The upper layers are pure Van der Waals stacking of hydrogen on top of hydrogen, with a binding energy in the order of 23 K according to Cuppen & Herbst (2007).
The ratio of ~2 between the estimated binding energies of H2 on the experimental ice and the value obtained in the solid state calculation may have several origins. One bias may come from the large distribution of energies found in TPD measurements (Dulieu et al. 2005; Hornekr et al. 2005), possibly influenced by the weak adsorption energy of H2 onto an important number of H2 layers piled on top of each other compared toa single layer of H2 in contact with the ice mantle. Another bias may be due to the calculation model itself in which we consider an isolated H2 on top of a crystalline ice. But, as shown by the values listed in Table 4, none of these eventual drawbacks could modify the conclusion that reaction of OH on an adsorbed H2 is a no barrier process.
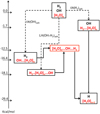 |
Fig. 6 Schematic profiles of the three mechanisms ER(OH)ads, ER(H2)ads and LH(OH+H2)ads leading to reconstruction of the cristalline ice. Dotted lines follow the adsorption path prior to the reaction. The solid species are in red characters within boxes. Energies are given with respect to the non interacting system. |
9 Conclusion
The present theoretical study of the reaction initially proposed by Tielens & Hagen more than 30 yr ago for the formation of the ice

shows that this process is efficient once a first layer of ice is present to assist in the growth of the ice mantle. Another important aspect is that this mechanism should be equally efficient in the reconstruction of the ice layers following the damages created by irradiations. This either in the Eley-Rideal process in which only OH is adsorbed or in the composite Langmuir-Hinschelwood process in which OH and H2 are both attached to the ice before reaction. In this context, there is an activation barrier opposing the formation of H2O that requires tunneling to proceed, the barrier being higher when the OH and H2 reagents are adsorbed. In a low temperatureenvironment (~10–30 K) the OH + H2 ads should give H2O directly i.e. without activation barrier whereas the conventional H2 + OH tunneling mechanisms should prevail above ~50 K. For intermediate situations these three mechanisms should cooperate in the reconstruction of the ice on the interstellar grains.
In the end, the type of catalytic reactions shown here on the example of the formation/reconstruction of the ice is probably more general. These results should be a motivation to carry out theoretical as well as experimental in-depth studies of bimolecular reactions at the surface of interstellar solids. This especially when the two reagents implied have adsorption energies whose difference is in the range of an order of magnitude or more.
Acknowledgements
This work was supported by CNRS national program PCMI (Physics and Chemistry of the Interstellar Medium) and COST Action CM 805, (The Chemical Cosmos). P.R. acknowledges the funding support from the Spanish Ministerio de Economia Industria y Competitividad (Grant AYA2017-87515-P) and the Junta de Castilla y León (Spain; Grant No. VA010G18).
Appendix A Solid state modeling
Modeling solid water has attracted increasing attention in the past fifteen years (Casassa & Pisani 2002; Calatayud et al. 2003; Kuo & Singer 2003; Hirsch & Ojamae 2004; Casassa et al. 2005). Levering on the conclusions of these works and our own experience (Lattelais et al. 2011, 2015; Mousis et al. 2016; Bertin et al. 2017), we took a periodic representation of solid water in the form of hexagonal ice Ih composed ofbi-layers of water molecules. To be consistent with the above study, the ice surface was described by the (0001) Miller indices. This choice of an apolar ice satisfying the Bernal & Fowler (1933) arrangement is computationally justified because only apolar structures can generate slabs that are stable (Bussolin et al. 1998), reproduce the bulk properties, and have a balanced distribution of alternate hydrogen and oxygen sites at their surfaces (for more details, see Casassa et al. 2005).
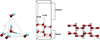 |
Fig. A.1 Bernal-Fowler arrangement (left) and Side views of the boat structure of hexagonal apolar ice unit cell (center) and (right) with two strata. It should be noted that one stratum of ice is composed of one crystallographic bi-layer of H2O molecules. |
Here, the basal plane dimensions (corresponding to the surface interacting with the adsorbate) are a = 7.145 Å and b = 8.73 Å. The third dimension of the cell c was determined so that there is no interaction between molecules generated by a translation perpendicular to the ice surface.
More insight in the Vienna Ab initio Simulation Package online3.
References
- Amiaud, L., Fillion, J. H., Dulieu, F., Momeni, A., & Lemaire, J. L. 2015, PCCP, 17, 30148 [Google Scholar]
- Bartlett, R. J., & Shavitt, I. 1977, Chem. Phys. Lett., 50, 190 [Google Scholar]
- Baulch, D. L., Cox, R. A., Hampson, R. F., et al. 1984, J. Phys. Chem. Ref. Data, 13, 1259 [Google Scholar]
- Becke, A. D. 1993, J. Chem. Phys., 98, 1372 [NASA ADS] [CrossRef] [Google Scholar]
- Bernal, J. D., & Fowler, R. H. 1933, J. Chem. Phys., 1, 515 [Google Scholar]
- Bertin, M., Doronin, M., Fillion, J. H., et al. 2017, A&A, 598, A18 [NASA ADS] [CrossRef] [EDP Sciences] [Google Scholar]
- Boogert, A. C. A., Pontoppidan, K. M., Knez, C., et al. 2008, ApJ, 678, 985 [NASA ADS] [CrossRef] [Google Scholar]
- Buch, V., Bauerecker, S., Devlin, J. P., Buck, U., & Kazimirski, J. K. 2004, Int. Rev. Phys. Chem., 23, 375 [CrossRef] [Google Scholar]
- Burke, D. J., & Brown, W. 2010, J. Phys. Chem. Chem.Phys., 12, 5947 [Google Scholar]
- Bussolin, G., Casassa, S., Pisani, C., & Ugliengo, P. 1998, J. Chem. Phys., 108, 9516 [NASA ADS] [CrossRef] [Google Scholar]
- Calatayud, M., Courmier, D., & Minot, C. 2003, Chem. Phys. Lett., 369, 287 [NASA ADS] [CrossRef] [Google Scholar]
- Casassa, S., & Pisani, C. 2002, J. Chem. Phys., 116, 9864 [NASA ADS] [CrossRef] [Google Scholar]
- Casassa, S., Calatayud, M., Doll, K., Minot, C., & Pisani, C. 2005, Chem. Phys. Lett., 409, 110 [NASA ADS] [CrossRef] [Google Scholar]
- Chen, J., Xu, X., Xu, X., & Zhang, D. H. 2013, J. Chem. Phys., 138, 154301 [Google Scholar]
- Cuppen, H. M., & Herbst, E. 2007, ApJ, 668, 294 [Google Scholar]
- Cuppen, H. M., Ioppolo, S., Romanzin, C., & Linnartz, H. 2010, Phys. Chem. Chem. Phys., 12, 12077 [NASA ADS] [CrossRef] [Google Scholar]
- Dartois, E., Cox, P., Roelfsema, P. R., et al. 1998, A&A, 338, L21 [NASA ADS] [Google Scholar]
- Doronin, M., Bertin, M., Michaut, X., Philippe, P., & Fillion, J.-H. 2015, J. Chem. Phys., 143, 084706 [NASA ADS] [CrossRef] [Google Scholar]
- Dulieu, F., Amiaud, L., Baouche, S., et al. 2005, Chem. Phys. Lett., 404, 187 [NASA ADS] [CrossRef] [Google Scholar]
- Eddington, A. S. 1926, The Observatory, 49, 304 [Google Scholar]
- Frisch, M., Trucks, G., Schlegel, H., et al., 2013 Gaussian 09, Revision D.01 (Gaussian, Inc., Wallingford CT) [Google Scholar]
- Gibb, E., Whittet, D. B., Boogert, A. A., & Tielens, A. G. G. M. 2004, Ap&SS, 151, 35 [Google Scholar]
- Govers, T. R., Mattera, L., & Scoles, G. 1980, J. Chem. Phys., 72, 5446 [NASA ADS] [CrossRef] [Google Scholar]
- Grimme, S., Antony, J., Ehrlich, S., & Krieg, H. 2010, J. Chem. Phys., 132, 154104 [Google Scholar]
- Hasegawa, T. I., & Herbst, E. 1993, MNRAS, 263, 589. [NASA ADS] [CrossRef] [Google Scholar]
- d’Hendecourt, L., Allamandola, L. J., & Greenberg, J. M. 1985, A&A, 152, 130 [Google Scholar]
- Hirsch, T. K.,& Ojamae, L. 2004, J. Phys. Chem. B, 108, 15856 [CrossRef] [Google Scholar]
- Hornekr, L., Baurichter, A., Petrunin, V. V., et al. 2005, J. Chem. Phys., 122, 124701 [NASA ADS] [CrossRef] [PubMed] [Google Scholar]
- Ioppolo, S., Cuppen, H. M., Romanzin, C., van Dishoeck, E. F., & Linnartz, H. 2010, Phys. Chem. Chem. Phys., 12, 12065 [NASA ADS] [CrossRef] [Google Scholar]
- Kresse, G., & Hafner, J. 1993, Phys. Rev. B, 48, 13115 [NASA ADS] [CrossRef] [Google Scholar]
- Kresse, G., & Hafner, J. 1994, Phys. Rev. B, 49, 14251 [Google Scholar]
- Kuo, J. L., & Singer, S. J. 2003, Phys. Rev. E, 67, 016114 [NASA ADS] [CrossRef] [Google Scholar]
- Lamberts, T., & Kästner, J. 2017, ApJ, 846, 43 [NASA ADS] [CrossRef] [Google Scholar]
- Lattelais, M., Bertin, M., Mokrane, H., et al. 2011, A&A, 532, A12 [NASA ADS] [CrossRef] [EDP Sciences] [Google Scholar]
- Lattelais, M., Pauzat, F., Ellinger, Y., & Ceccarelli, C. 2015, A&A, 572, A62 [Google Scholar]
- Lynch, B. J., Fast, P. L., Harris, M., & Truhlar, D. G. 2000, J. Phys. Chem. A, 104, 4811 [Google Scholar]
- Meisner, J., Lamberts, T., & Kästner, J. 2017, Earth Space Sci., 1, 399 [Google Scholar]
- Merrill, K. M., Russell, R. W., & Soifer, B. T. 1976, Icarus, 207, 763 [Google Scholar]
- Mokrane, H., Chaabouni, H., Accolla, M., et al. 2009, ApJ, 705, L195 [NASA ADS] [CrossRef] [Google Scholar]
- Mousis, O., Ronnet, T., Brugger, B., et al. 2016, ApJ, 823, L41 [NASA ADS] [CrossRef] [Google Scholar]
- Oba, Y., Watanabe, N., Hama, T., et al. 2012, ApJ, 749, 67 [NASA ADS] [CrossRef] [Google Scholar]
- Oberg, K. I., Boogert, A. C. A., Pontoppidan, K. M., et al. 2011, ApJ, 740, 109 [NASA ADS] [CrossRef] [Google Scholar]
- Pan, D., Liu, L. M., Tribello, G. A., et al. 2010, J. Phys. Condens. Matter, 22, 074209 [Google Scholar]
- Pauzat, F., Lattelais, M., Ellinger, Y., & Minot, C. 2011, MNRAS, 412, 2729 [NASA ADS] [CrossRef] [Google Scholar]
- Perets, H. B., Biham, O., Manico, G., et al. 2005, ApJ, 627, 850 [NASA ADS] [CrossRef] [Google Scholar]
- Raghachavari, K., Trucks, G. W., Pople, J. A., & Head-Gordon, M. 1989, Chem. Phys. Lett., 157, 479 [Google Scholar]
- Redondo, P., Pauzat, F., Ellinger, Y., & Markovits, A. 2020, A&A, 638, A125 [EDP Sciences] [Google Scholar]
- Ruaud, M., Wakelam, V., & Hersant, F. 2016, MNRAS, 459, 3756 [NASA ADS] [CrossRef] [Google Scholar]
- Tielens, A. G. G. M., & Hagen, W. 1982, A&A, 114, 245 [Google Scholar]
- Vidali, G., Ihm, G., Kim, H. Y., & Cole, M. 1991, Surf. Sci. Rep., 12, 133 [Google Scholar]
- Wakelam, V., Ruaud, M., Hersant, F., et al. 2016, A&A, 594, A35 [NASA ADS] [CrossRef] [EDP Sciences] [Google Scholar]
- Whittet, D. C. B., Bode, M. F., Longmore, A. J., et al. 1988, MNRAS, 233, 321 [NASA ADS] [CrossRef] [Google Scholar]
- Zao, Y., & Truhlar, D. G. 2004, J. Phys. Chem. A, 108, 6908 [CrossRef] [Google Scholar]
With binding energies of ~0.7–1.7 kcal mol−1 on ice (Govers et al. 1980; Perets et al. 2005; Burke & Brown 2010; Amiaud et al. 2015) and ~0.9 kcal mol−1 for graphene (average (Vidali et al. 1991; Pauzat et al. 2011) the surface number densities of H2 ads are close, namely, 0.3 × 1015 cm−2 and 0.8 × 1015 cm−2 on water ice and graphene, respectively. This ratio of ~2.5 is not correlated to the difference between the binding energies on these different surfaces but simply to the greater number of adsorption sites i.e. 6 nearest neighbors for graphene versus 2 for ice (Pauzat et al. 2011).
The CCSD(T) reaction path of H2 + OH with three H2O molecules was correctly reproduced by this procedure. As an example, the transition state is located 5.10, 4.92 and 4.85 kcal mol−1 above the reference at the MPWB1K/aug-cc-pVTZ, MPWB1K/6-311++G(3df,2p)//MPWB1K/3-21+G** and MPWB1K/aug-cc-pVTZ// MPWB1K/3-21+G** levels, respectively.
All Tables
Relative energies (kcal mol−1) of critical points along the reaction profile for H) + OH(2 Π) → H2O(1A1) + H(2 S), including zero point vibrational energies.
Electronic binding energies(*) (kcal mol−1) of H2 ads and OHads as a function of the number (n) of H2O in the supporting cluster.
Relative energies (kcal mol−1) for the reaction profile for H) + OHads(2Π) → H2O(1A1) + H(2 S) as a function of the number of H2O molecules in the supporting cluster.
Transition state energies(*) ΔH# (kcal mol−1) with respect to the energies of the reactants (OH)ads, (H2)ads, and (OH+H2)ads as a function of the number (n) of H2O in the supporting cluster.
All Figures
|
Fig. 1 Adsorption of OH (left) and H2 (right) on ice; the same arrangements are found (not shown) for large clusters 24(1-L.) and 48(2-L.). |
| In the text | |
|
Fig. 2 Reaction profile for H |
| In the text | |
|
Fig. 3 Reaction profile for H |
| In the text | |
|
Fig. 4 Structures of the transition state (left) and final product of the OH first process for H2 + OHads → H2Oads + H on top of solid water ice. |
| In the text | |
|
Fig. 5 Reaction profile for H2 ads(1Σ+) + OHads(2Π) → H2Oads(1A1) + H(2 S) at the MPWB1K/aug-cc-pVTZ level in presence of a 1-layer of H2O. Relative energies are given in kcal mol−1. |
| In the text | |
|
Fig. 6 Schematic profiles of the three mechanisms ER(OH)ads, ER(H2)ads and LH(OH+H2)ads leading to reconstruction of the cristalline ice. Dotted lines follow the adsorption path prior to the reaction. The solid species are in red characters within boxes. Energies are given with respect to the non interacting system. |
| In the text | |
|
Fig. A.1 Bernal-Fowler arrangement (left) and Side views of the boat structure of hexagonal apolar ice unit cell (center) and (right) with two strata. It should be noted that one stratum of ice is composed of one crystallographic bi-layer of H2O molecules. |
| In the text | |
Current usage metrics show cumulative count of Article Views (full-text article views including HTML views, PDF and ePub downloads, according to the available data) and Abstracts Views on Vision4Press platform.
Data correspond to usage on the plateform after 2015. The current usage metrics is available 48-96 hours after online publication and is updated daily on week days.
Initial download of the metrics may take a while.