Fig. 9.
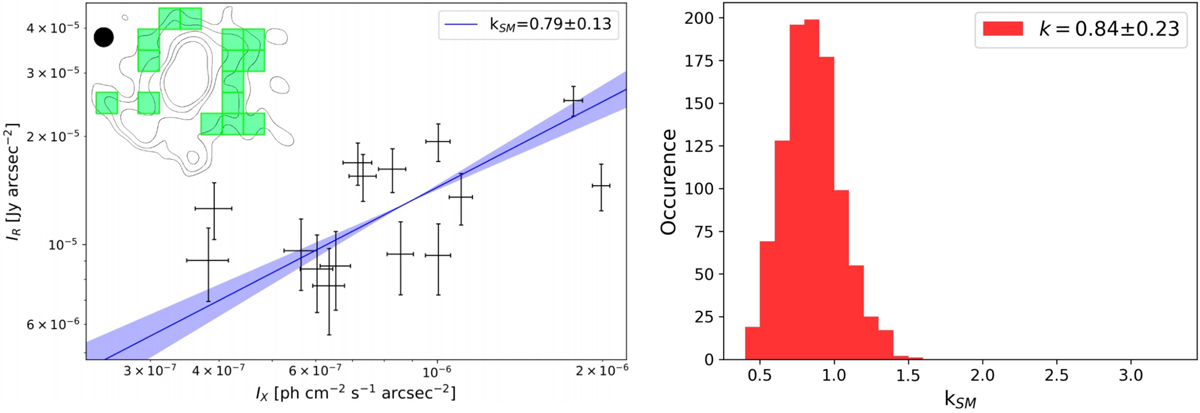
Results from Monte Carlo point-to-point analysis. Left: an example of an estimate for k using a particular choice for the grid position. The data points and error bars show the estimated radio surface brightness vs. X-ray surface brightness for a given grid cell. The slope of the best-fit power law through these data (blue line) is shown in the legend. The contours in the top-left corner indicate the [3,6,12,24,48] × σ contours of the circularly-smoothed L-band image with a Briggs robust parameter of −1, where σ = 18 μJy. The beam size is 2.8 arcseconds circular, and is indicated by the solid black circle. Right: histogram of all values of k from the Monte Carlo point-to-point analysis. The resulting best estimate for kMC is reported in the legend.
Current usage metrics show cumulative count of Article Views (full-text article views including HTML views, PDF and ePub downloads, according to the available data) and Abstracts Views on Vision4Press platform.
Data correspond to usage on the plateform after 2015. The current usage metrics is available 48-96 hours after online publication and is updated daily on week days.
Initial download of the metrics may take a while.