Open Access
Fig. 8.
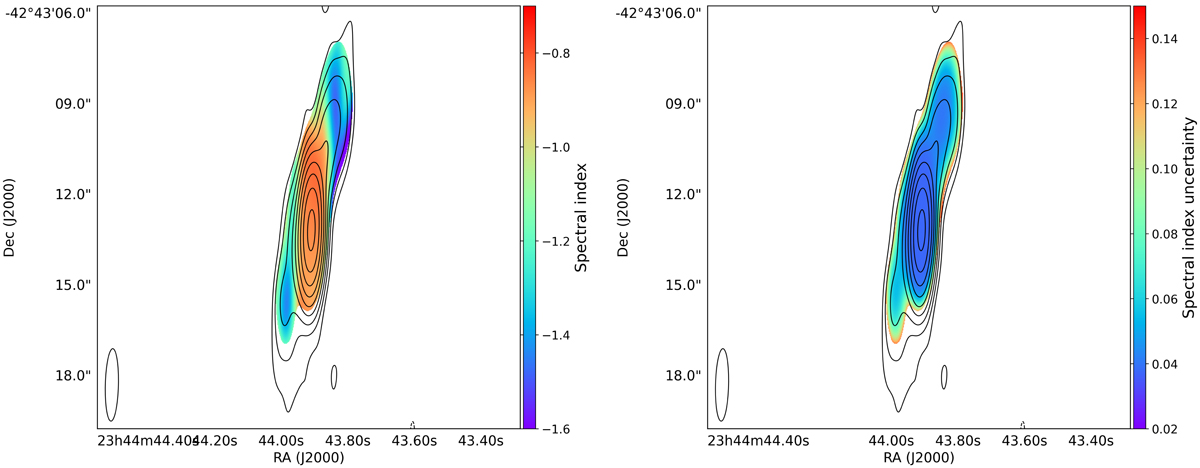
Left: spectral index map from L- and X-band images. Right: corresponding uncertainties of the spectral index map. The contours show the X-band image smoothed to the L-band resolution and they are drawn at [ − 1, 1, 2, 4, 8, ...]× 4σrms, where σrms = 2.6 μJy beam−1. The beam is shown in the bottom-left corner.
Current usage metrics show cumulative count of Article Views (full-text article views including HTML views, PDF and ePub downloads, according to the available data) and Abstracts Views on Vision4Press platform.
Data correspond to usage on the plateform after 2015. The current usage metrics is available 48-96 hours after online publication and is updated daily on week days.
Initial download of the metrics may take a while.