Fig. 6.
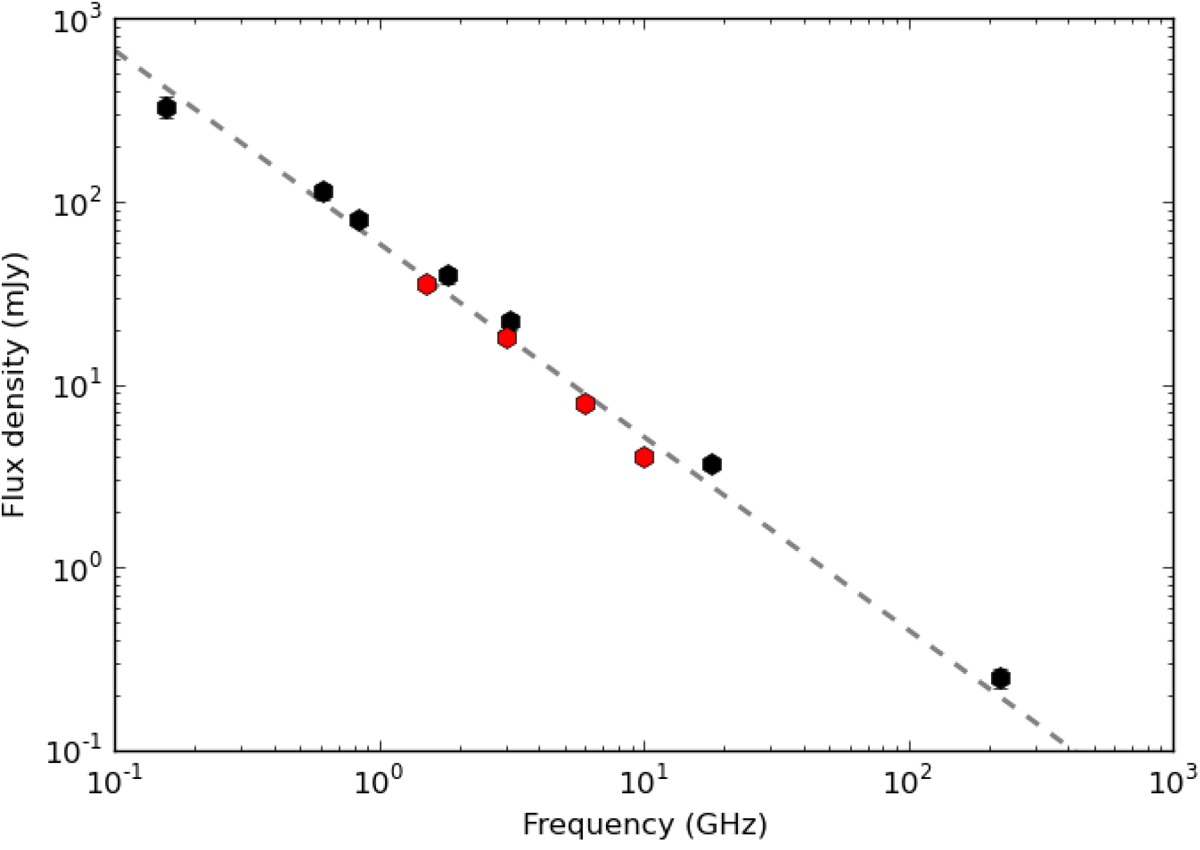
Spectral energy distribution of Phoenix cluster. The black dots show data obtained from literature. The red dots show data presented in this work. The best-fit spectral index through the data is −1.12 ± 0.02. A curvature term is included in the fit, but is found to be negligible. The data point at 220 GHz is excluded from the fit as free-free and thermal dust emissions are expected to contribute significantly at this frequency.
Current usage metrics show cumulative count of Article Views (full-text article views including HTML views, PDF and ePub downloads, according to the available data) and Abstracts Views on Vision4Press platform.
Data correspond to usage on the plateform after 2015. The current usage metrics is available 48-96 hours after online publication and is updated daily on week days.
Initial download of the metrics may take a while.