Fig. 5.
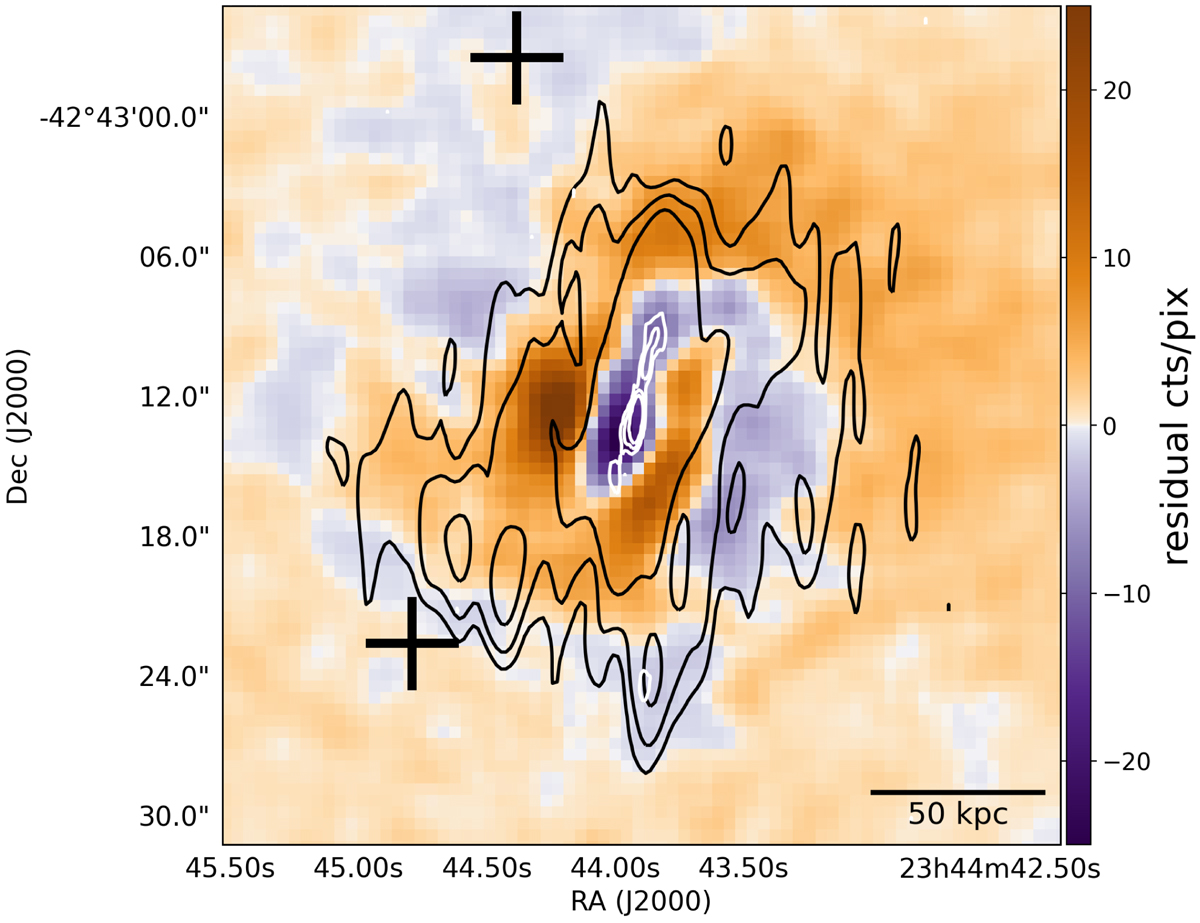
Residuals of Chandra X-ray image (McDonald et al. 2015) minus a β-model. The residuals were smoothed by a boxcar function with a scale of three pixels (1.5 arcsec). The white contours indicate the emission in the X band as observed with the VLA and are drawn at [ − 1, 1, 4, 16] × 4σrms, where σrms = 2.2 μJy beam−1. The black contours indicate the emission in the L band as observed with the VLA, and are drawn at [ − 1, 1, 2, 4] × 4σrms, where σrms = 10.8 μJy beam−1. The black pluses indicate the positions of the ghost cavities detected by McDonald et al. (2015).
Current usage metrics show cumulative count of Article Views (full-text article views including HTML views, PDF and ePub downloads, according to the available data) and Abstracts Views on Vision4Press platform.
Data correspond to usage on the plateform after 2015. The current usage metrics is available 48-96 hours after online publication and is updated daily on week days.
Initial download of the metrics may take a while.