Fig. 14.
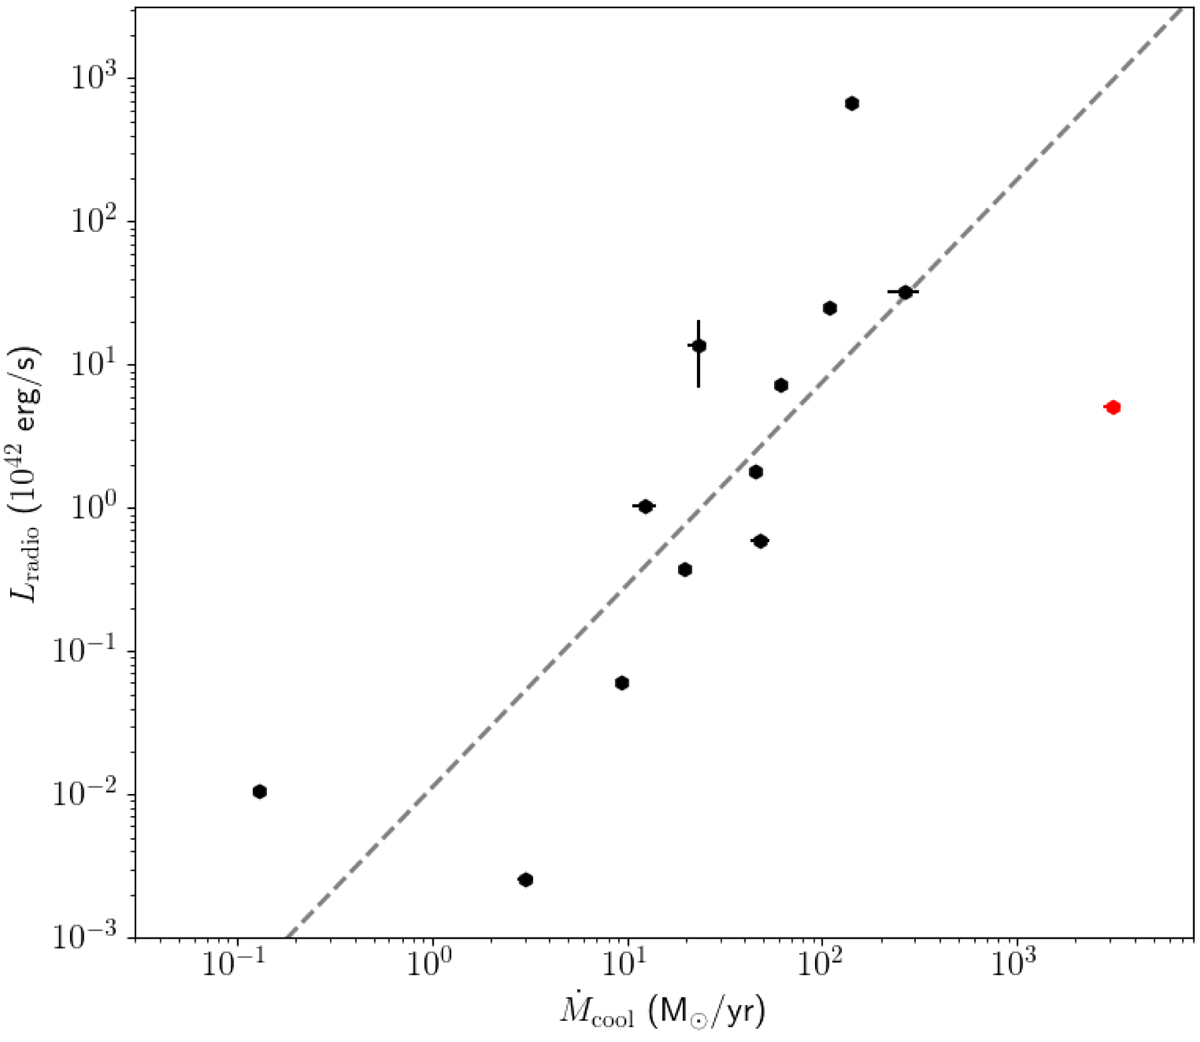
ICM cooling rate Ṁcool vs. bolometric radio luminosity of lobes between 10 MHz and 10 GHz. The red data point indicates the Phoenix cluster, and the black data points indicate the sample of Bîrzan et al. (2008). The dashed line shows the best power-law fit through the data and is given by log Lradio[1042erg s−1] = (1.41 ± 0.35) log Ṁcool[M⊙/yr] − (1.95 ± 0.53). Phoenix cluster data are from McDonald et al. (2019) and this work, and data for the other clusters are from Bîrzan et al. (2008), McDonald et al. (2019).
Current usage metrics show cumulative count of Article Views (full-text article views including HTML views, PDF and ePub downloads, according to the available data) and Abstracts Views on Vision4Press platform.
Data correspond to usage on the plateform after 2015. The current usage metrics is available 48-96 hours after online publication and is updated daily on week days.
Initial download of the metrics may take a while.